

By Ali Bolourchi
We are living through one of the most aggressive shifts in Ontario real estate history. The headlines scream "More Homes Built Faster," but the fine print tells a different story—one of shifting financial burdens, eroding rights, and a fundamental change in who controls our neighbourhoods.
If you are following along with our latest presentation, "The Price of Building Faster," this guide will walk you through the slides one by one to uncover the hidden costs of Ontario's legislative blitz.

The Pivot
The Big Picture: Beyond the Headlines
We often get bogged down in small details like Vacant Home Taxes, but the real story is much bigger. Ontario has launched an unprecedented legislative campaign—primarily through Bill 23 and Bill 60—to tackle the housing crisis.
The Goal: Build 1.5 million homes by 2031.
The Reality: This isn't just a construction plan. It’s a complex restructuring of the economy that affects homeowners, renters, and municipalities alike.
The Numbers Don't Lie
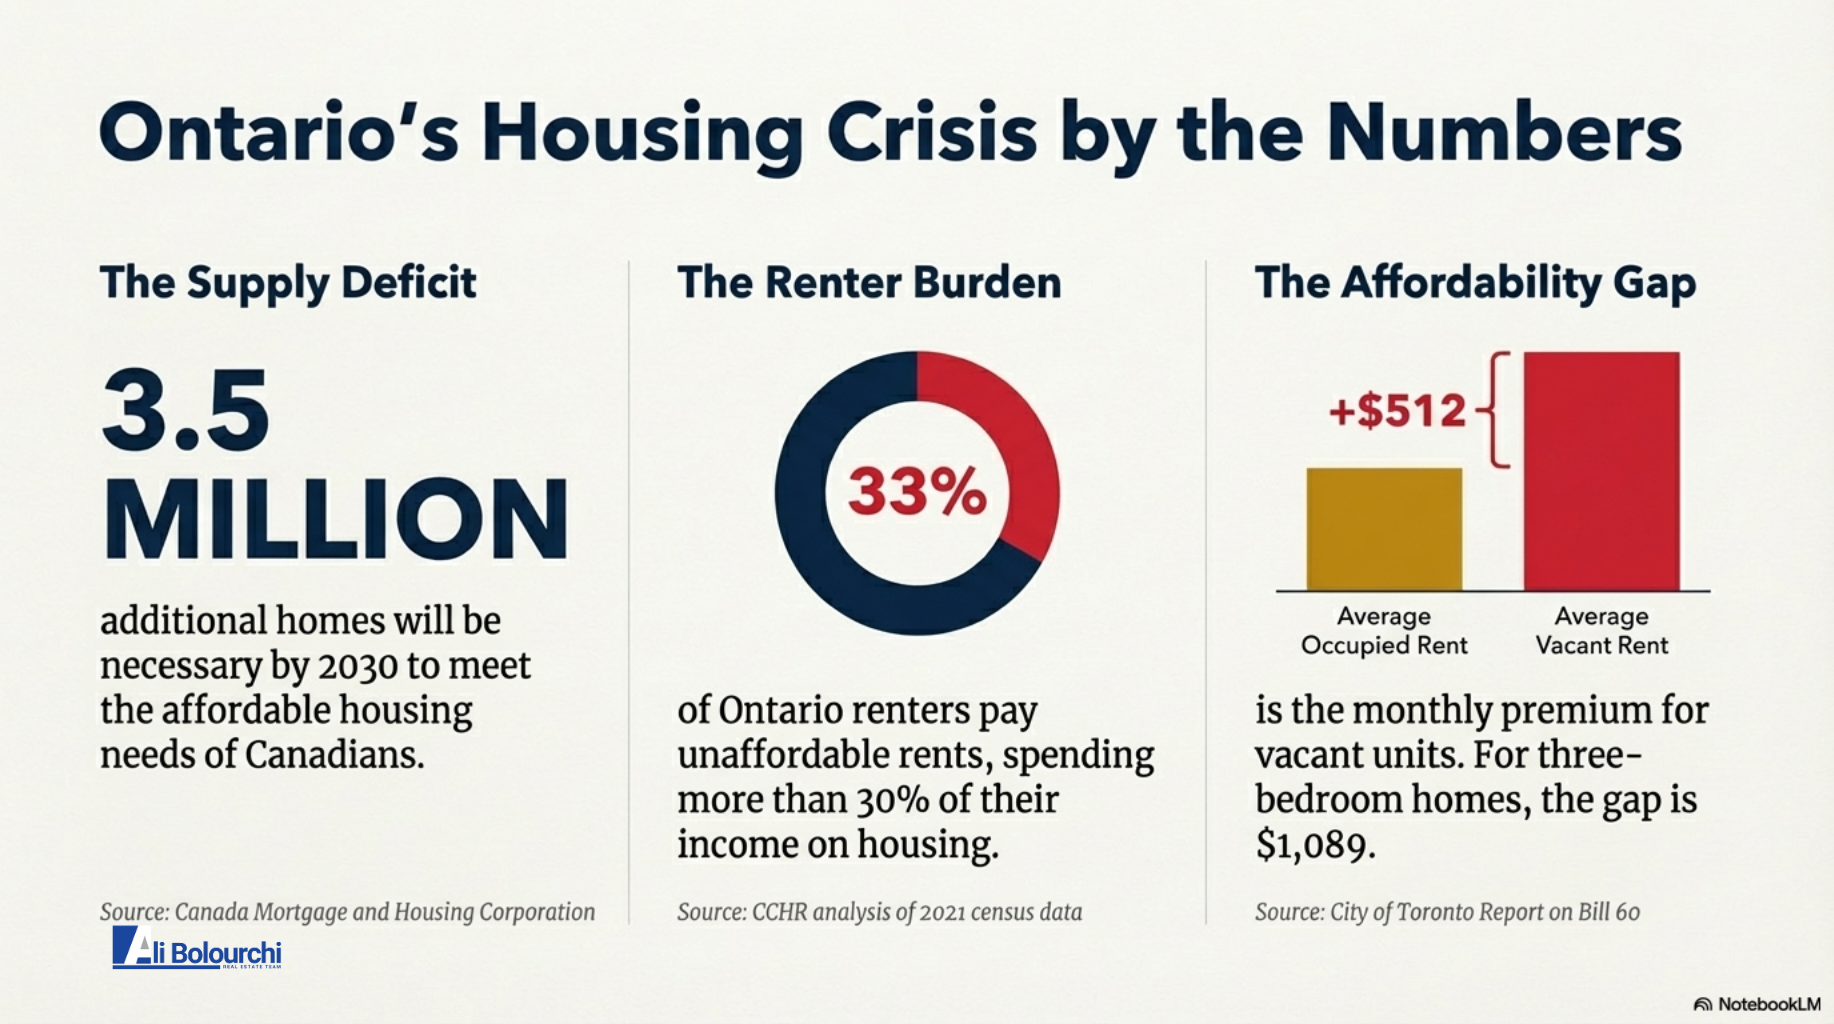
Defining the Crisis
To understand the solution, we have to look at the problem. The numbers are staggering:
The Supply Gap: We need 3.5 million additional homes across Canada by 2030 to restore affordability.
The Renter Squeeze: A full 33% of Ontario renters are paying unaffordable rents (spending more than 30% of their income on housing).
The "Turnover" Tax: There is now a $512 monthly gap between what a current tenant pays and what a landlord charges for a vacant unit. This creates a massive financial incentive for landlords to turn over units, pushing rents higher every time a tenant moves out.
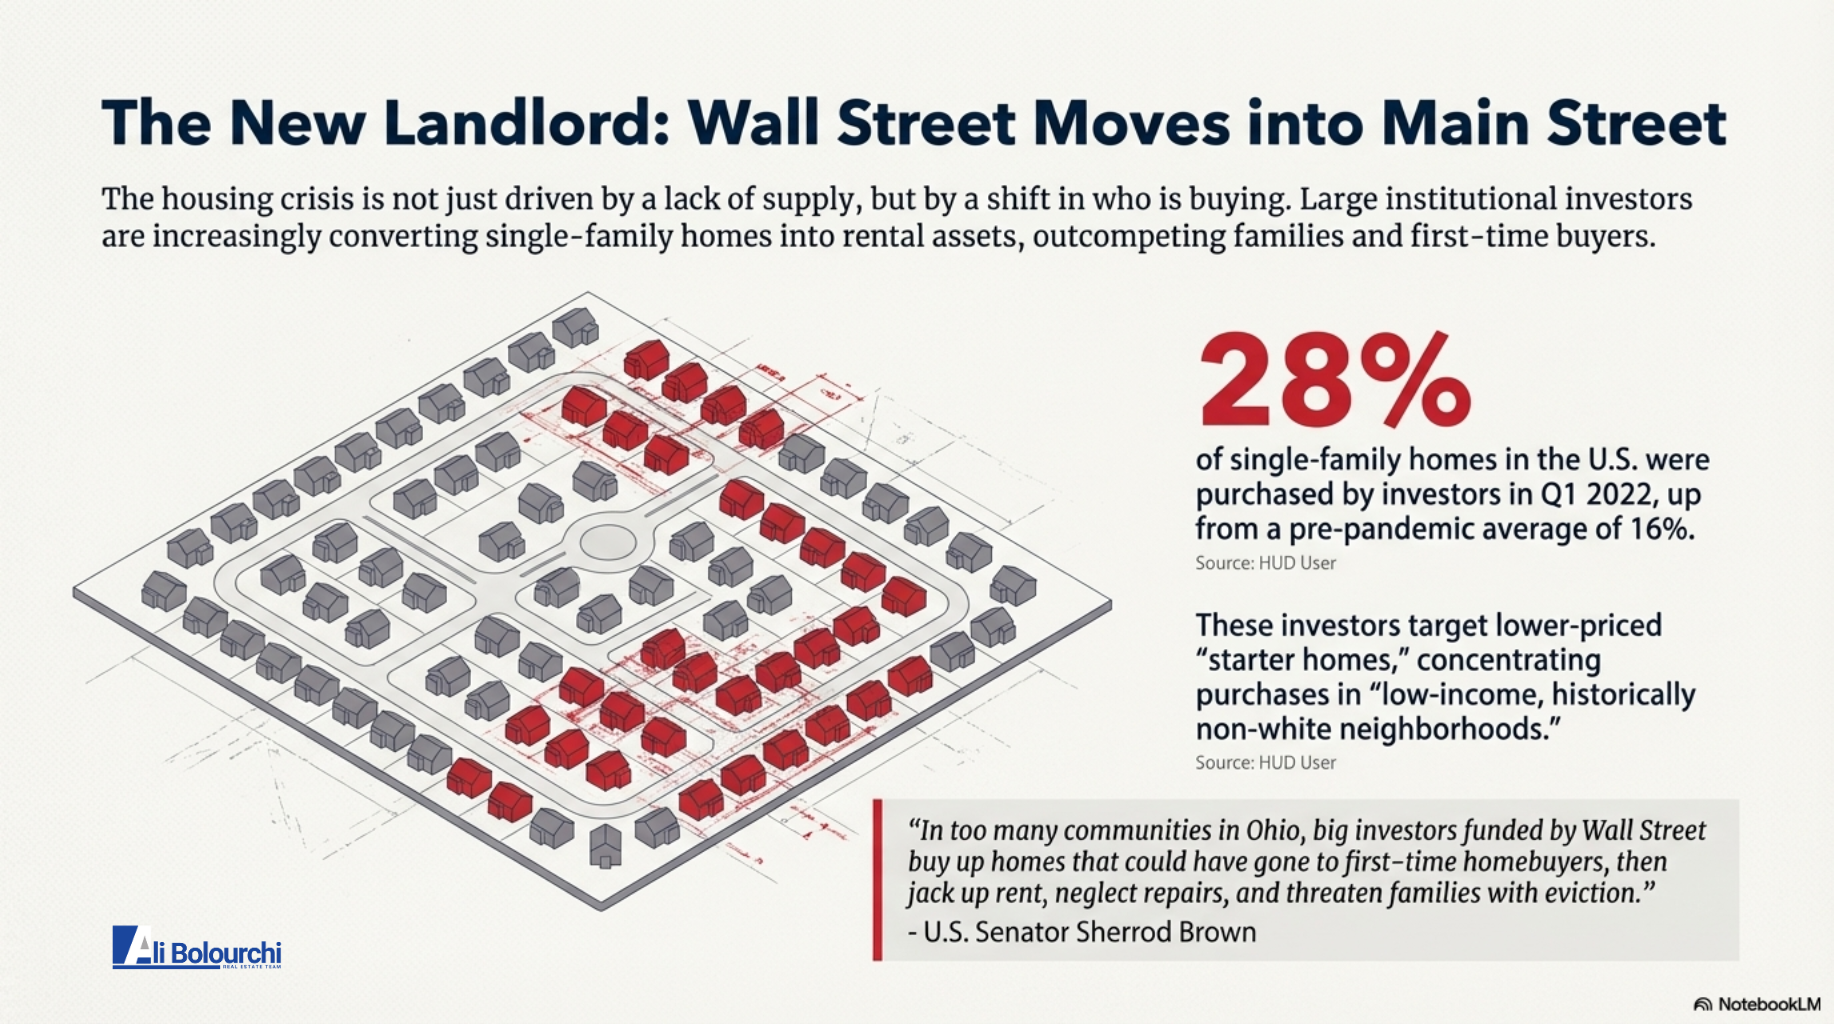
The New Competitor
Wall Street Moves onto Main Street
This slide highlights a disturbing trend. The crisis isn't just about a lack of supply; it's about who is buying the supply.
Institutional Investors: Big corporations are increasingly buying up single-family "starter homes" to turn them into rental assets.
The Stat: In the U.S., investor purchases jumped to 28% of single-family homes recently.
The Impact: These investors often target lower-priced neighbourhoods, effectively outbidding first-time buyers and families. As Senator Sherrod Brown noted, this leads to higher rents and neglected repairs as homes become mere lines on a balance sheet.
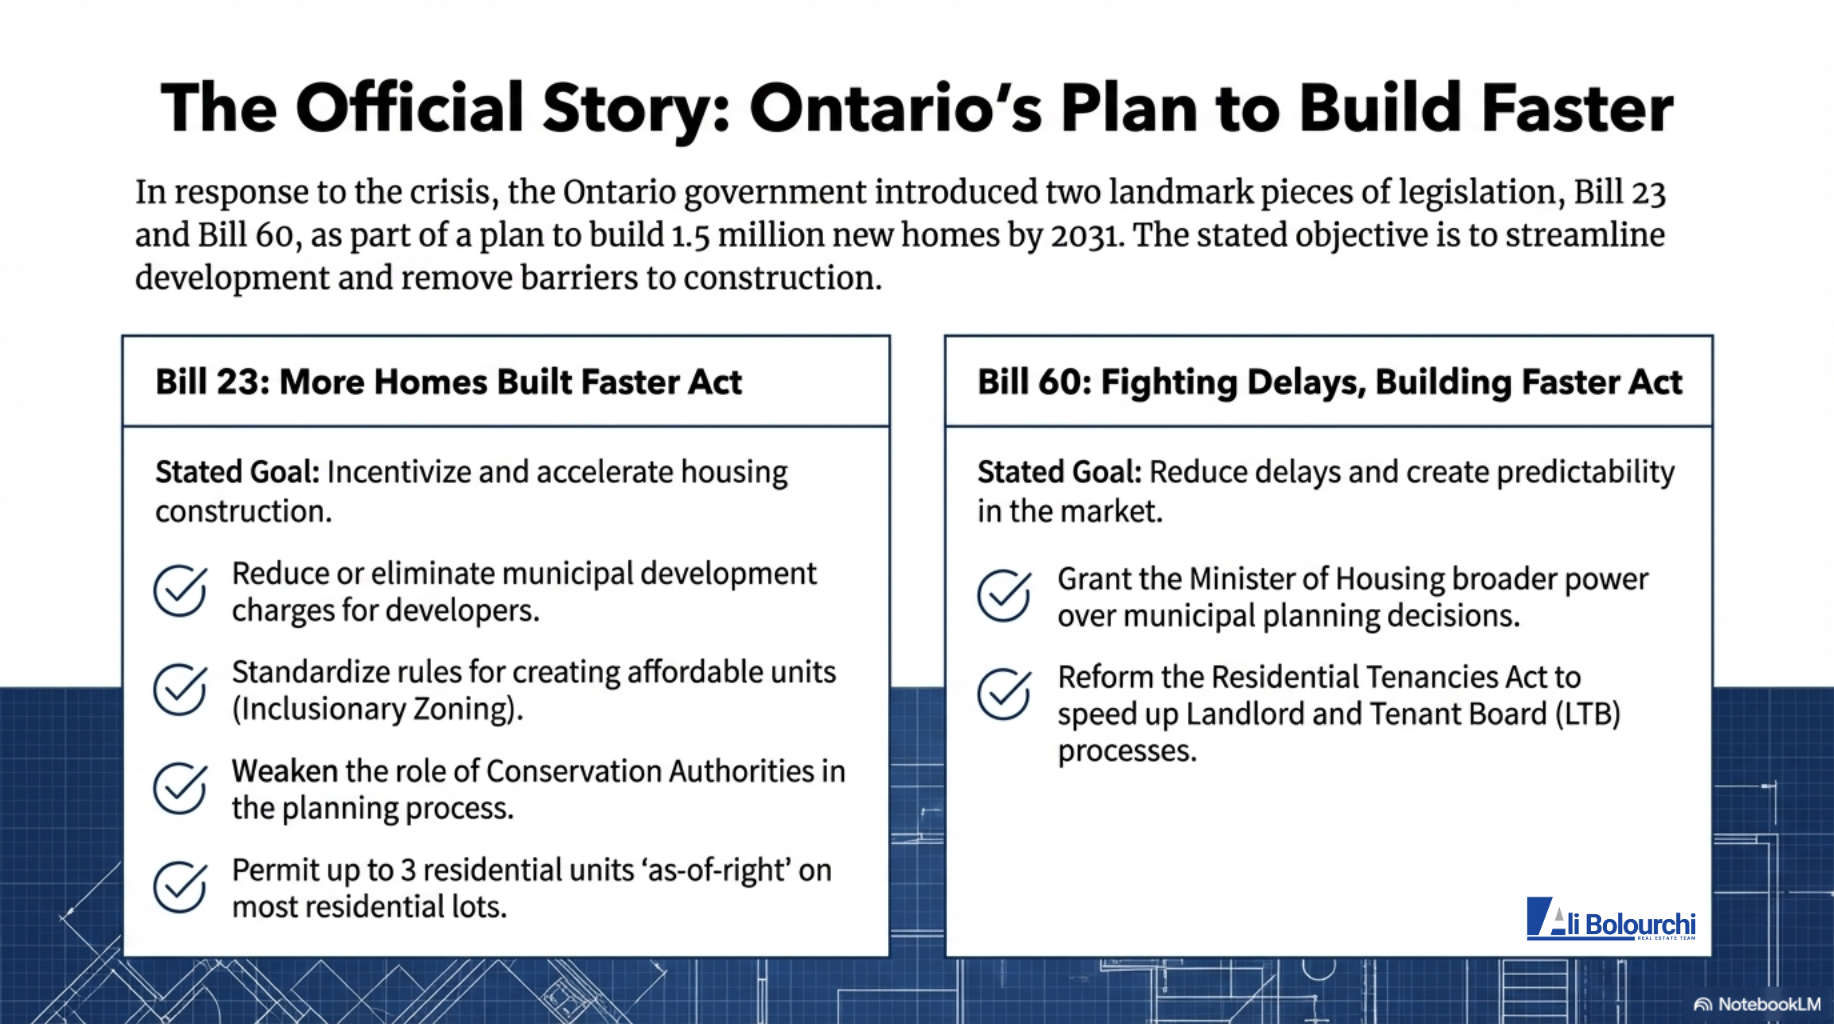
The Official Blueprint
Bill 23 & Bill 60 Explained
Here is the government's two-pronged approach to solving the problem:
Bill 23 (More Homes Built Faster Act): The goal here is to incentivize construction by cutting fees (Development Charges) for developers and allowing up to 3 units on a single lot "as-of-right" (meaning you don't need special permission to add a basement or garden suite).
Bill 60 (Fighting Delays, Building Faster Act): This bill focuses on the Landlord and Tenant Board (LTB), aiming to speed up hearings and grant the Minister of Housing more power over city planning.

The Taxpayer Bill
Shifting the Burden from Developers to You
This is the slide that should make every homeowner sit up and take notice.
The Mechanism: Development Charges (DCs) are fees developers pay to cities to fund new infrastructure (roads, sewers, parks). Bill 23 cuts these fees to encourage building.
The Consequence: The cost of that infrastructure doesn't vanish. It gets transferred to the property taxpayer.
The Whitby Case Study: The Town of Whitby estimates this will cost them $34 million a year. To make up the difference, they may need to raise property taxes by 30%, or roughly $600 per average home.
The Toronto Impact: Toronto estimates a loss of $130 million annually, which disproportionately hurts services for low-income residents.

Redefining "Affordable"
A Definition That Misses the Mark
Bill 23 introduces a province-wide definition of "affordable housing" to qualify for those fee exemptions. But does it actually help those in need?
The Definition: "Affordable" is defined as 80% of the average market rent or purchase price.
The Reality: In today's market, 80% of a sky-high rent is still expensive. For a low-income household earning $900/month, a "Bill 23 Affordable" unit costing $2,400/month is impossible. This definition helps developers qualify for tax breaks, but it fails to create housing for those in "core housing need".
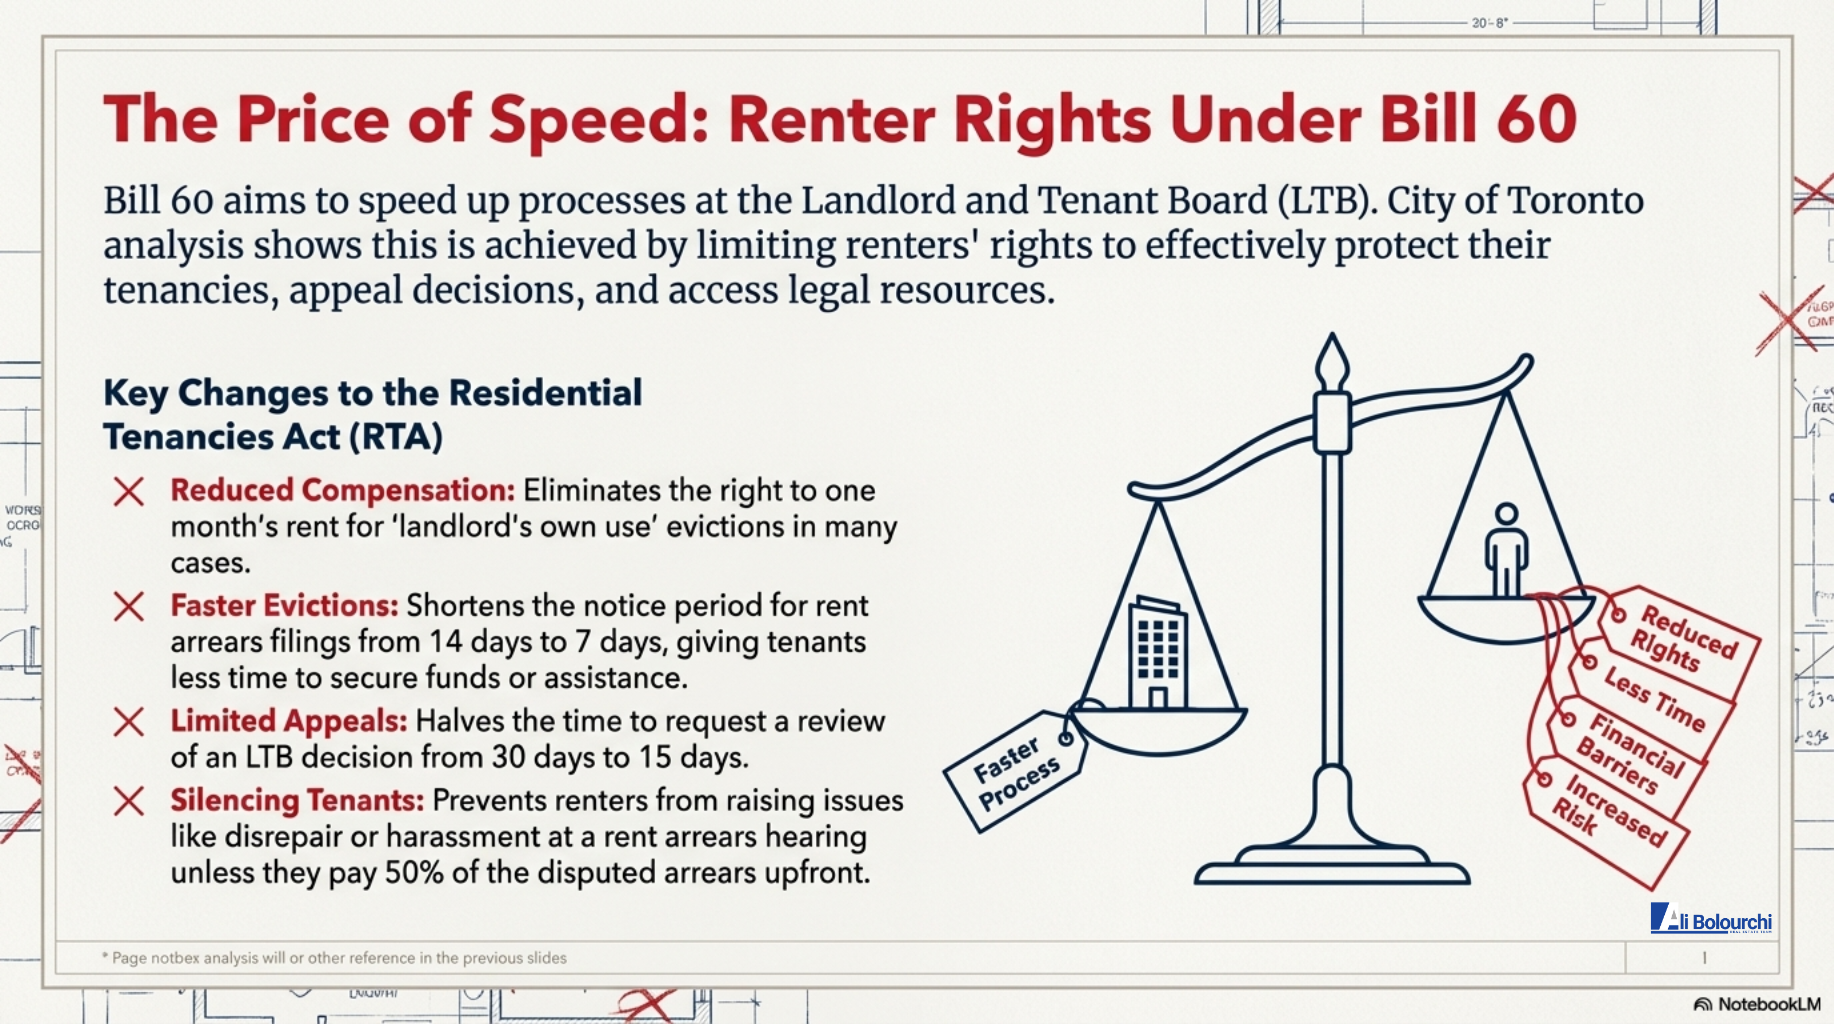
The Price of Speed
Renter Rights Under Bill 60
We want a faster Landlord and Tenant Board (LTB), but Bill 60 achieves speed by cutting corners on tenant rights.
Faster Evictions: The notice period for rent arrears (N4) is slashed from 14 days to 7 days. If you lose your job, you now have one week, not two, to figure it out before the legal clock starts ticking.
Reduced Compensation: Tenants lose the right to one month's rent as compensation for certain "landlord's own use" evictions.
Silenced Defenses: Tenants can no longer raise issues like maintenance or harassment at an arrears hearing unless they pay a portion of the disputed rent upfront.
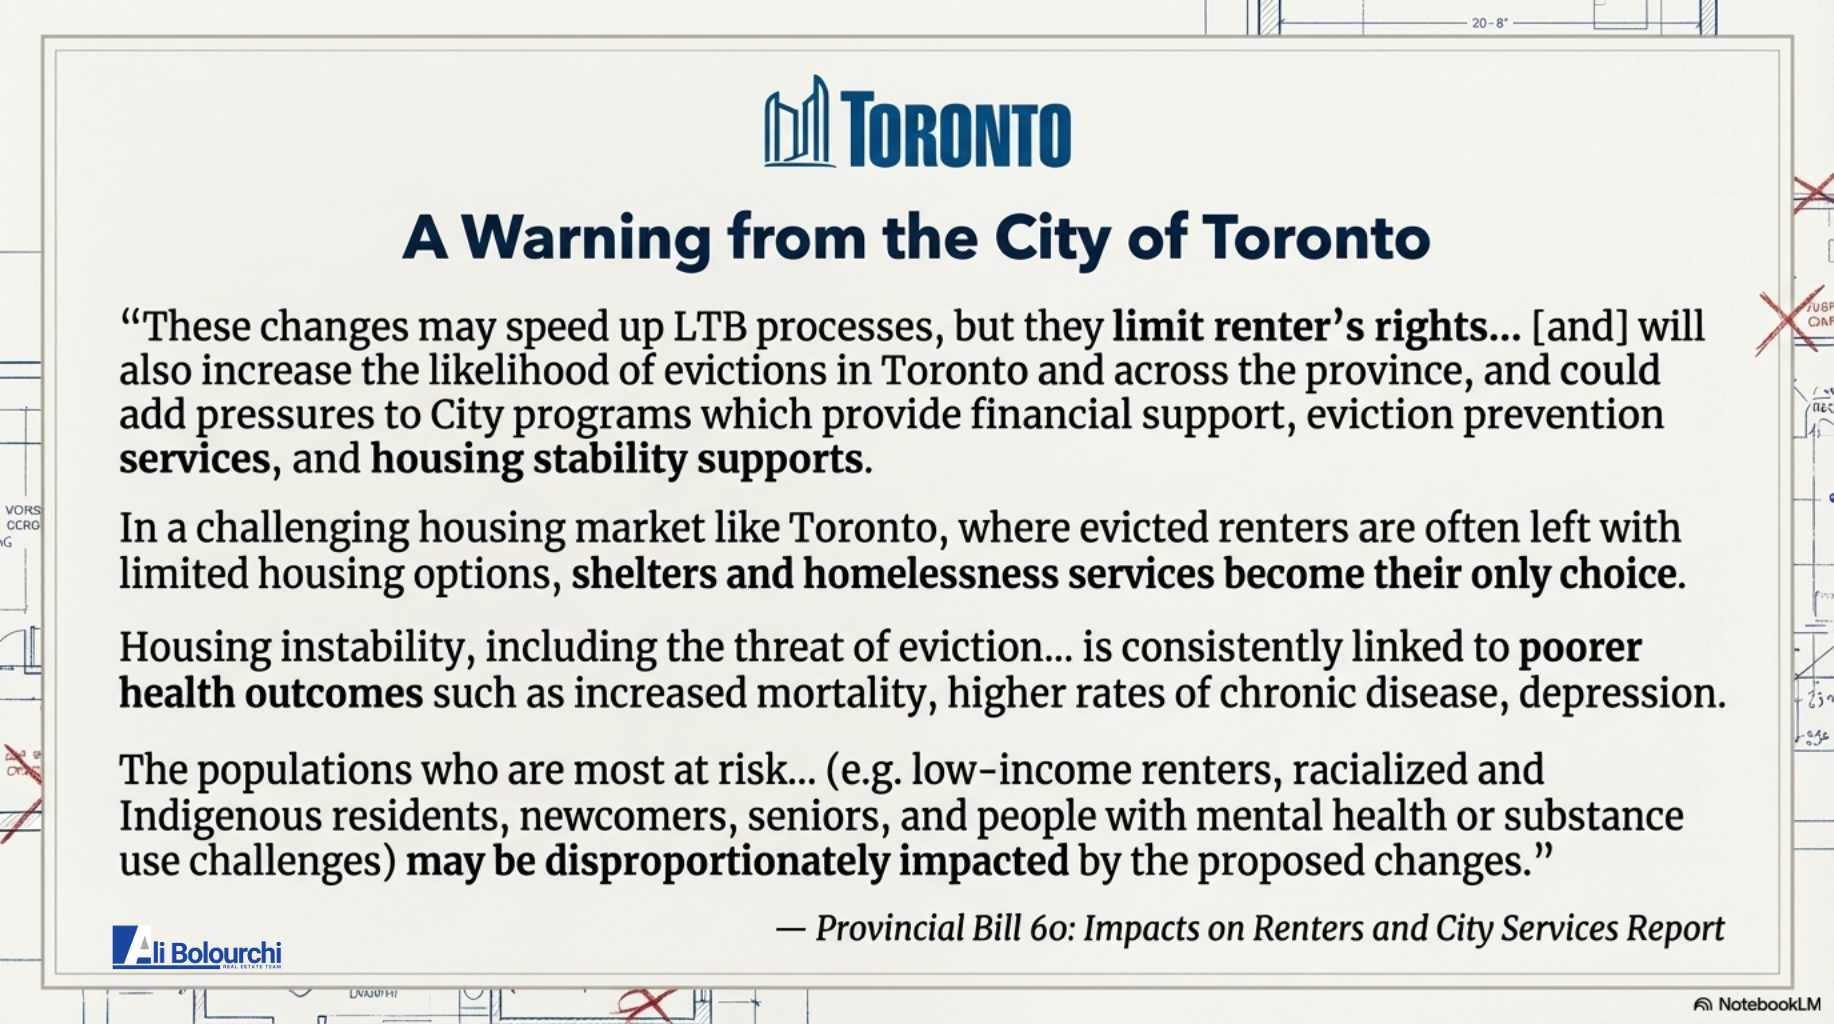
The City's Warning
Risks of Homelessness
The City of Toronto has issued a stark warning: these changes will increase eviction rates.
The Domino Effect: In a tight market, an evicted tenant often has nowhere to go but a shelter. The City warns that this will add pressure to homelessness services and lead to poorer health outcomes for vulnerable populations.

The Power Grab
Sidelining Local Voices
This slide illustrates the massive centralization of power.
Ministerial Override: The Minister of Housing can now make planning decisions that don't even have to align with the provincial land-use planning statement.
Silencing the Public: Bill 23 removes the requirement for public meetings for certain subdivision approvals.
Environmental Risk: The role of Conservation Authorities is drastically reduced, putting environmentally sensitive areas at risk to speed up development.

The Short-Term Rental Problem
The Fight for Long-Term Homes
It's not just about building new homes; it's about keeping the ones we have.
The Leak: There are 235,000 active short-term rentals (STRs) across Canada, removing 1.4% of the total housing supply from the long-term market.
The Rules: In places like Toronto, you can only STR your principal residence for a maximum of 180 nights a year. Enforcing these rules is critical to bringing units back to the rental market.
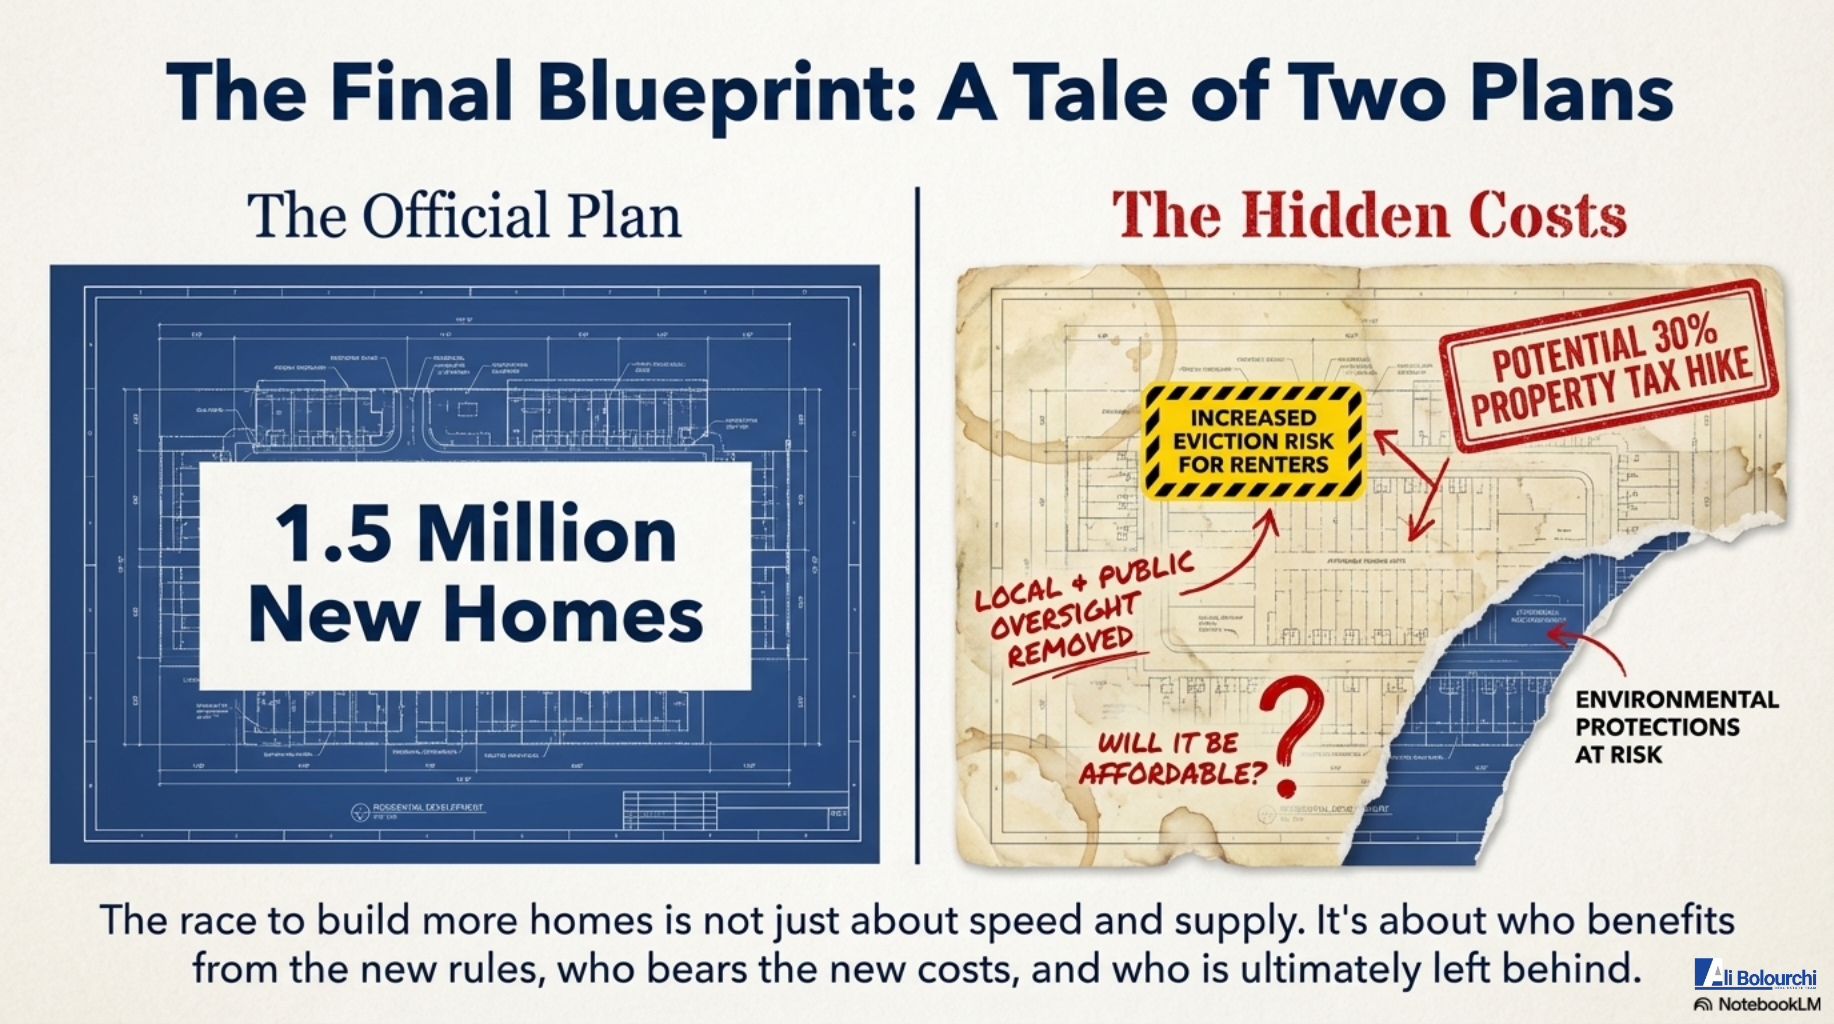
The Conclusion
A Tale of Two Plans
We end with a comparison.
The Official Plan: 1.5 million new homes.
The Hidden Costs: A potential 30% property tax hike, increased eviction risks, reduced environmental protections, and the removal of local oversight.
WHENThe race to build is necessary, but we must ask: Who bears the cost? As we move forward, it is clear that without careful navigation, the burden is falling on taxpayers and tenants, while the benefits skew toward large-scale development and investment.