RSS

The Rate-Cut Rebound: Is September 2025 the Low-Water Mark for GTA Home Prices?

The Greater Toronto Area (GTA) housing market is sending a clear message: after a prolonged cooling period, momentum is back. With home sales jumping and prices stabilizing after the Bank of Canada's recent rate cut, a major market shift is underway.

Buyers, stop what you are doing! The market bottom isn't a theory—it's happening right now in East Toronto (E01, E02, E03)!  While most of the GTA is seeing price dips, this pocket of the 416 is showing aggressive activity that signals a true, strong rebound.

This isn't just an overall trend—it’s a dynamic, neighbourhood-by-neighbourhood evolution. To understand where you stand as a buyer, seller, or investor, you need to look closer at what’s happening in the City of Toronto (416) versus the surrounding regions (905), segmented by home type.


Detached Homes: The Tale of Two Markets

Detached homes saw a solid sales increase, rising 9.6% year-over-year across the GTA. However, the price performance tells a contrasting story between the core and the suburbs.

  • Resilient Value. Prices in the City of Toronto core are fiercely holding their value, suggesting deep, stable demand for large, premium properties.

  • Affordability Play. The deeper price correction in the suburbs is successfully attracting buyers back into the largest segment of the market.

  • For Buyers: Look to the 905 if you prioritize a lower entry price and are willing to commute. Look to the 416 if you prioritize stability, as prices there have barely corrected.

Semi-Detached Houses: The Core's Biggest Winner 🏆

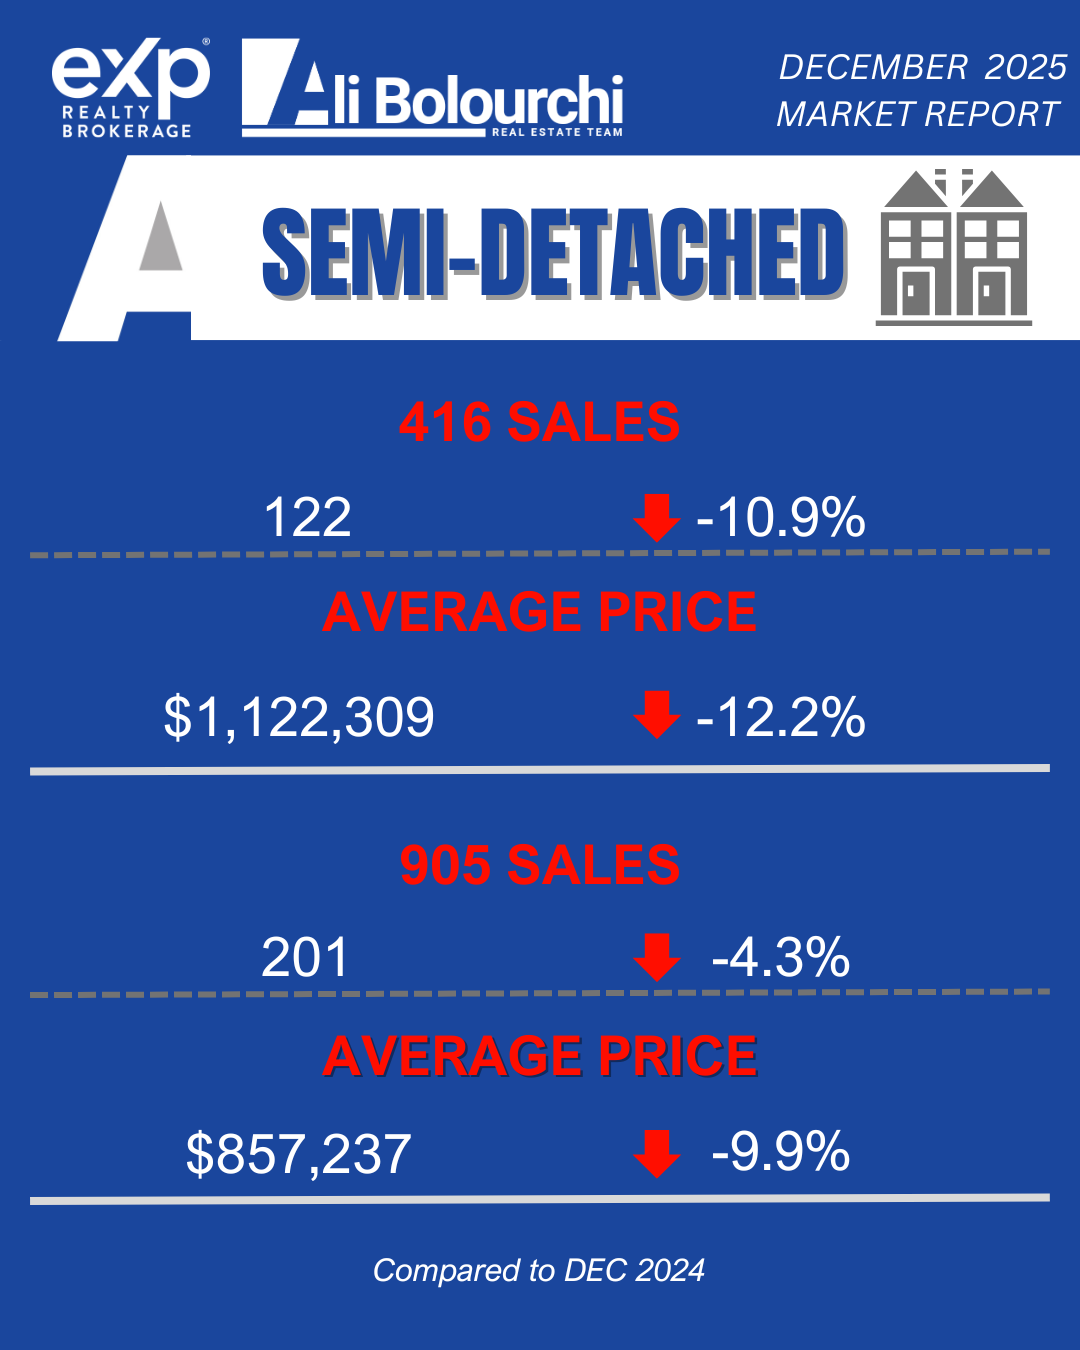
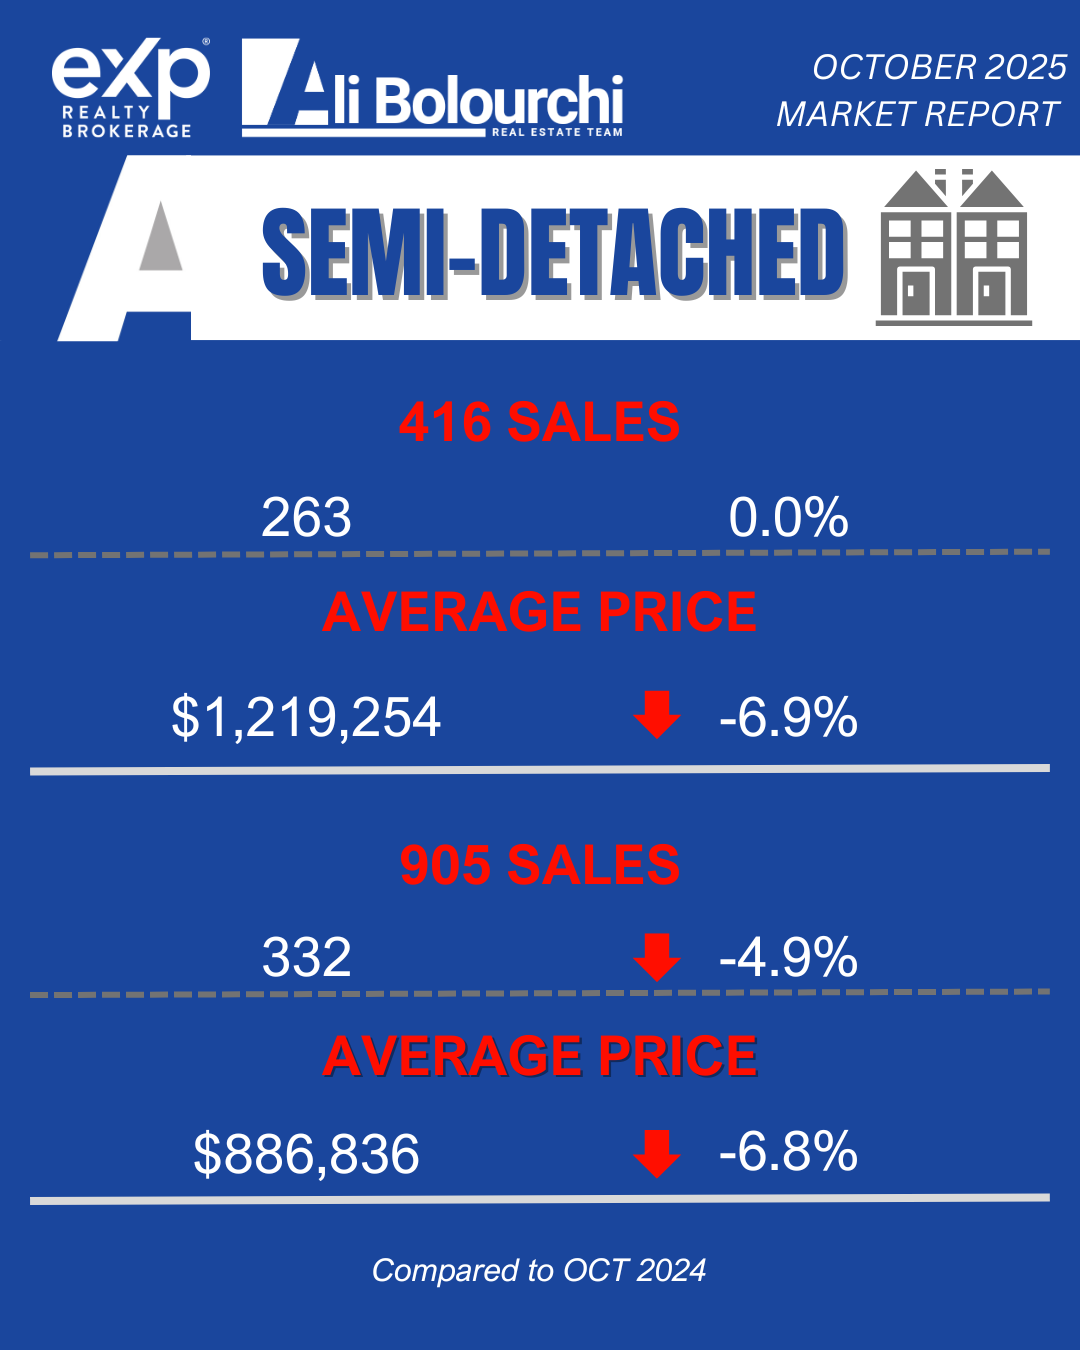
The semi-detached segment is an undeniable bright spot for September, marking the largest sales increase among all housing types, up 11.0% across the GTA. This home type is a key indicator of move-up and first-time buyer demand, offering an excellent balance of space and relative value.

  • Intense Demand. Buyers are aggressively re-entering the 416 market for this key housing type, driving huge sales growth.

  • Solid Growth. Sales growth remains robust, reinforcing the attractiveness of the 905 as a more affordable option near the $900K average.

  • For Sellers: If you own a semi-detached in the 416, now is the time to list. The huge jump in sales volume suggests strong competition among buyers.

Townhouses (Attached/Row): The Value Play

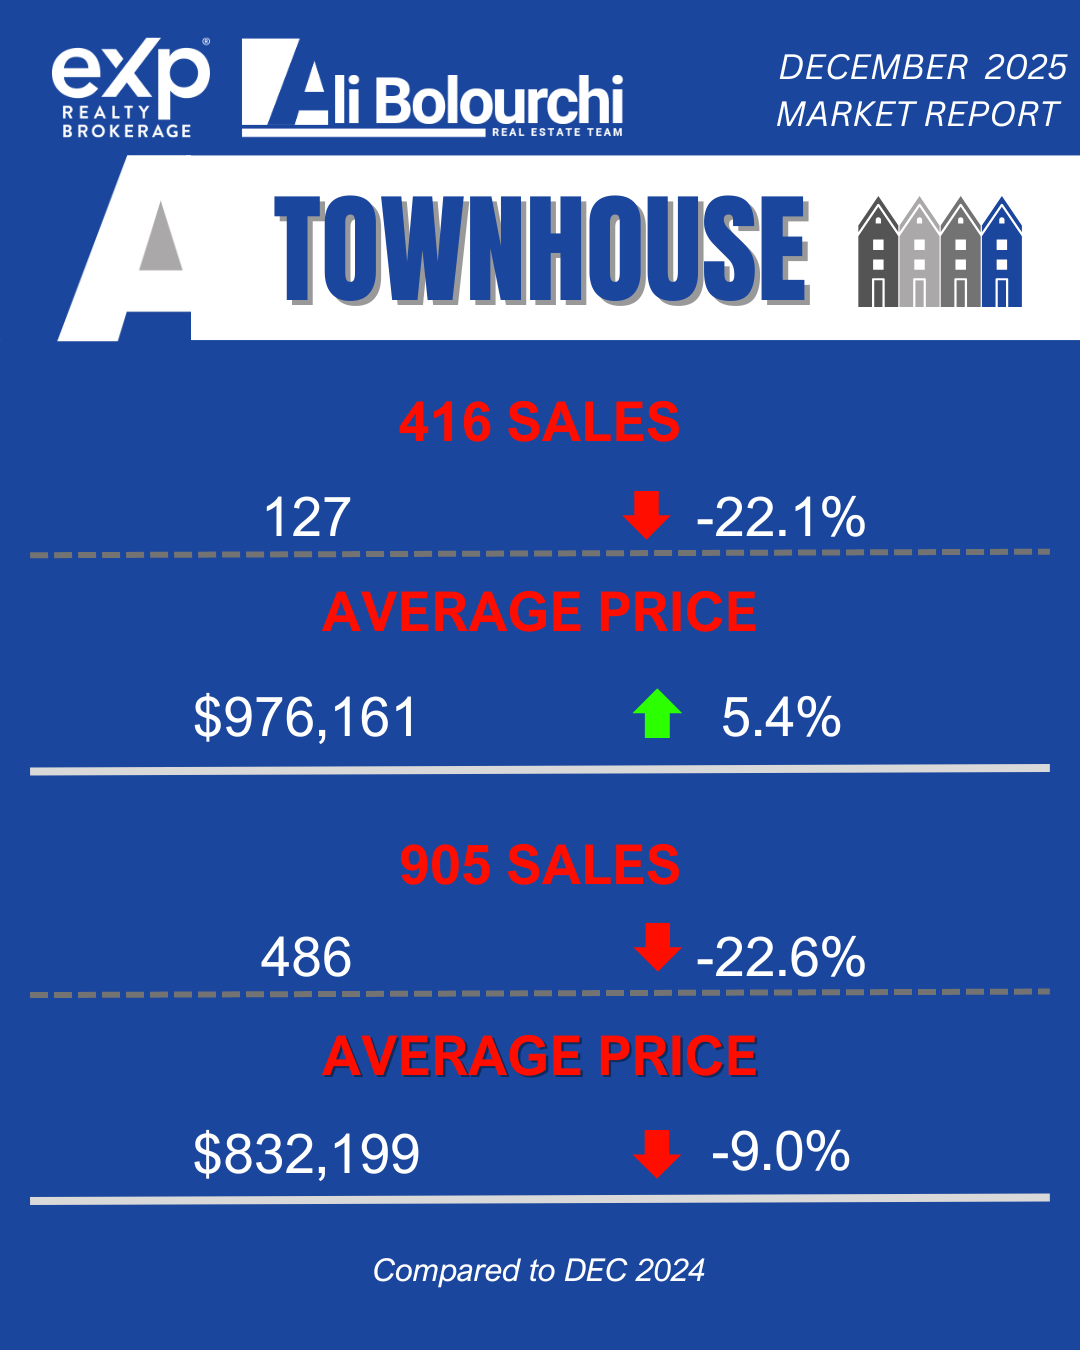
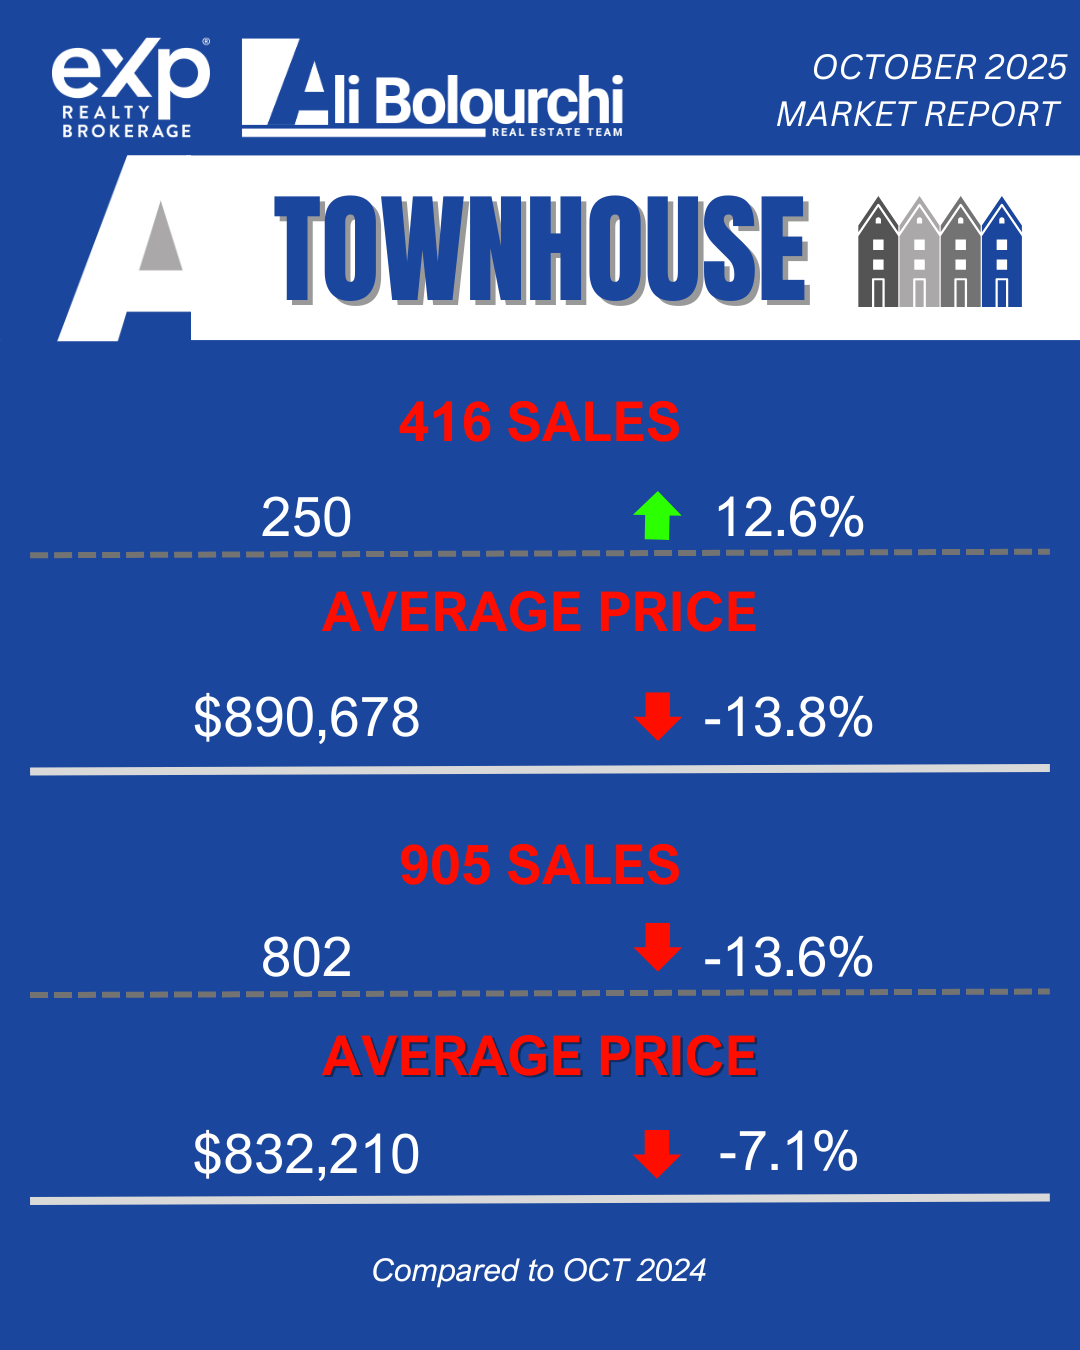
Townhouses, including both freehold and condo towns, continue to be a sweet spot for affordability and value, with total sales up 4.4% year-over-year.

  • Massive Shift. The near 40% sales surge in the 416 shows a huge buyer migration to get into ground-related housing for under $1 million.

  • Stable Affordability. Sales dipped slightly, but the $837,748 average price continues to appeal to first-time buyers seeking a freehold option.

  • For Buyers: The 905 remains a highly compelling choice for townhouses, with average prices sitting around the low-$800,000s, far more affordable than the City of Toronto.

Condo Apartments: The Entry Point

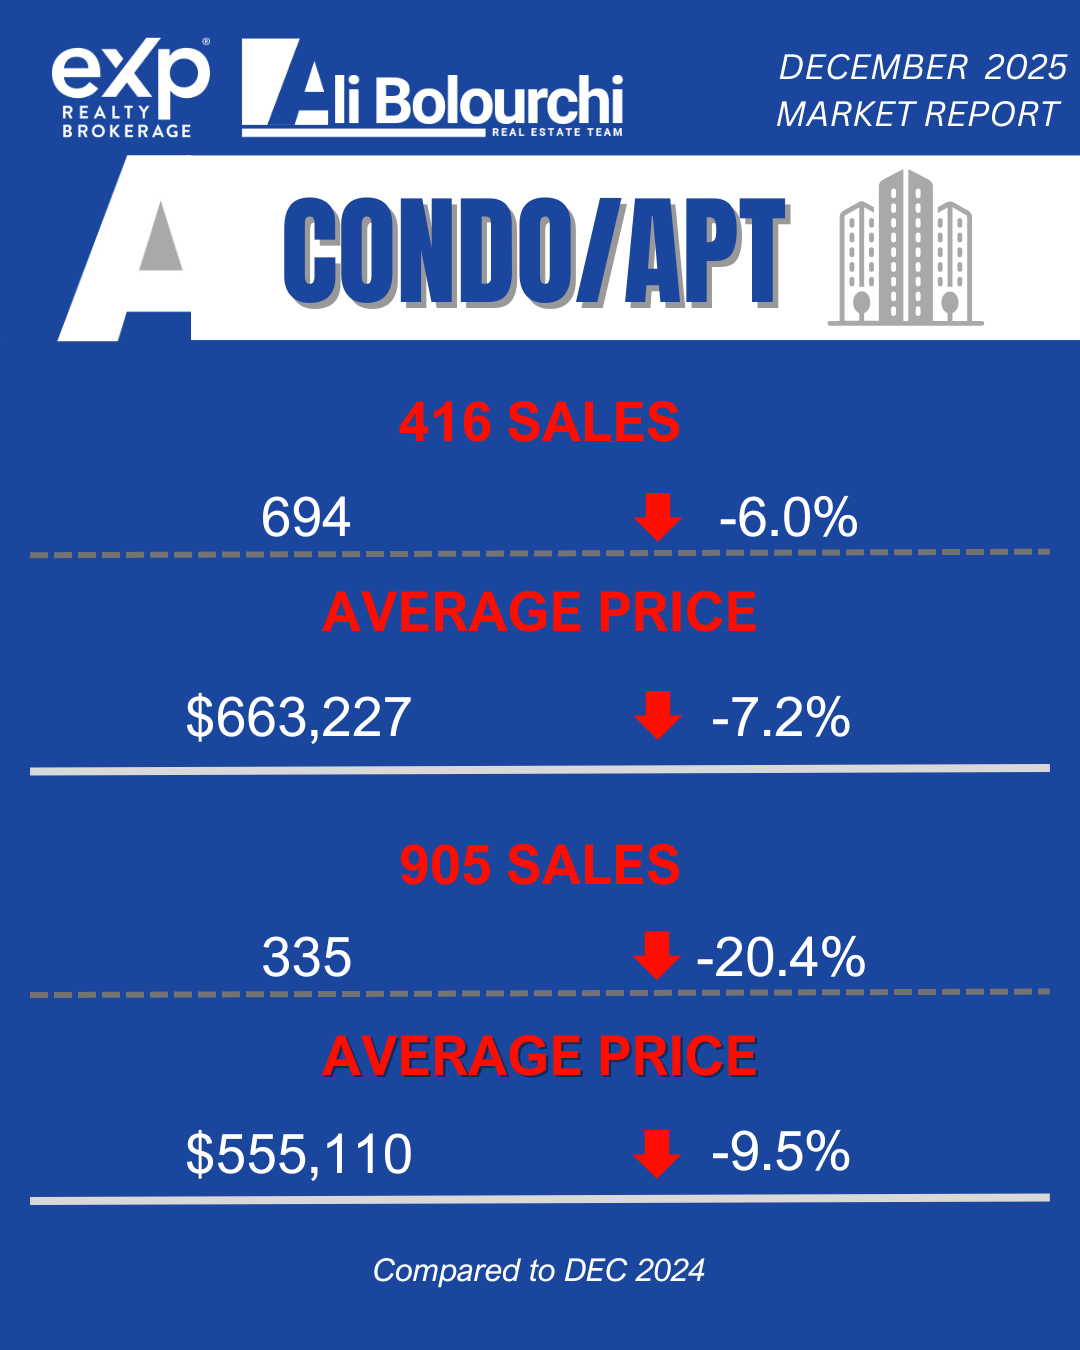
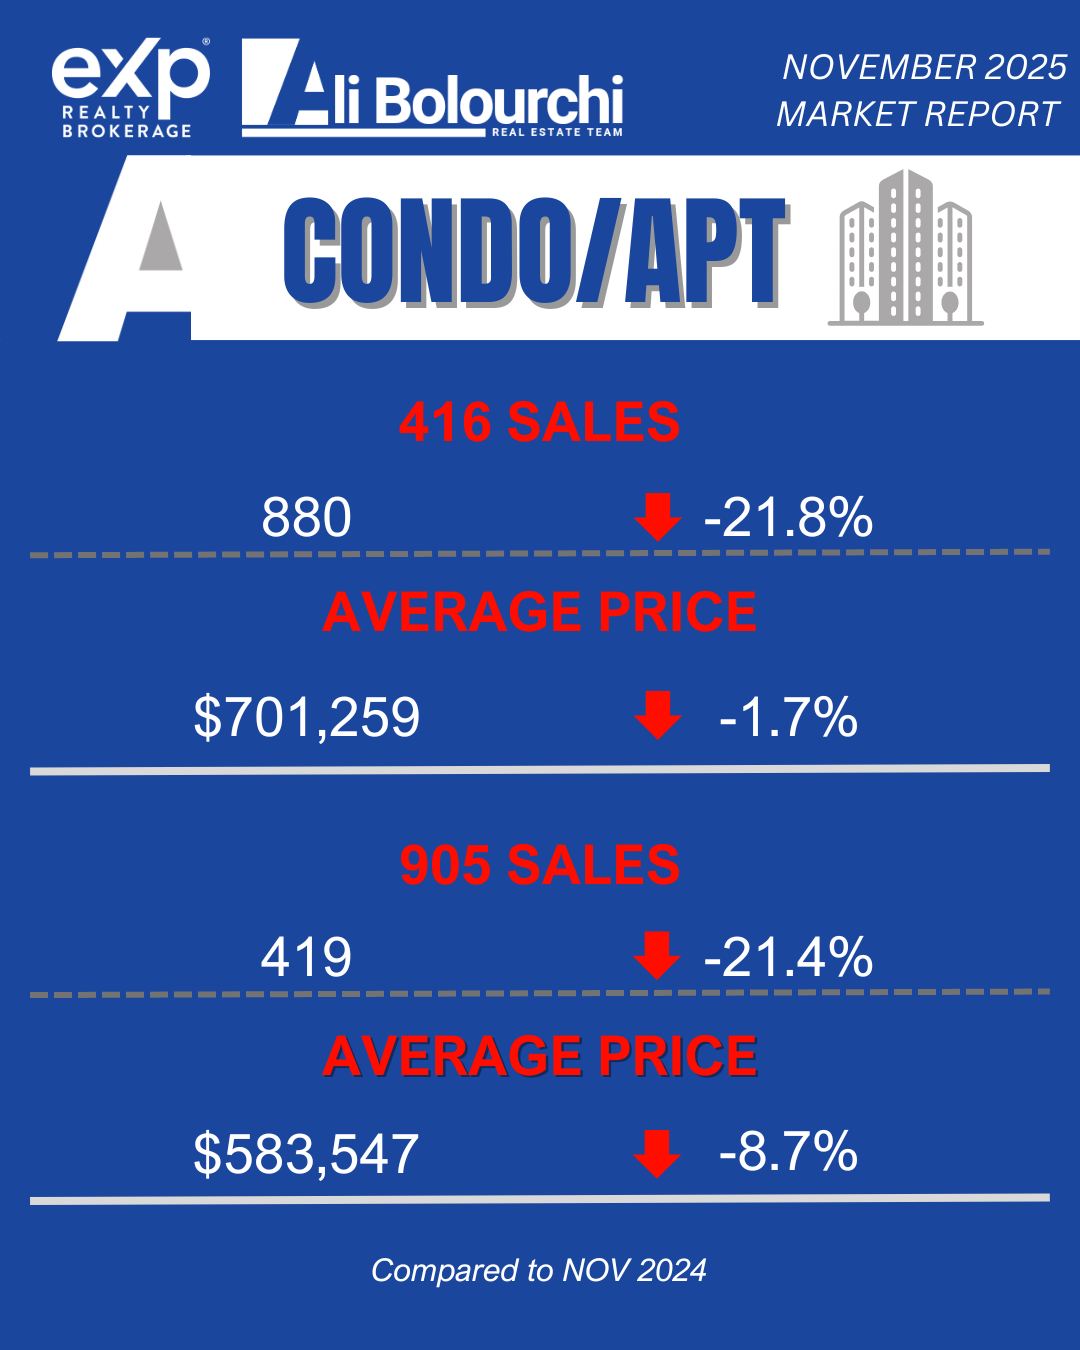
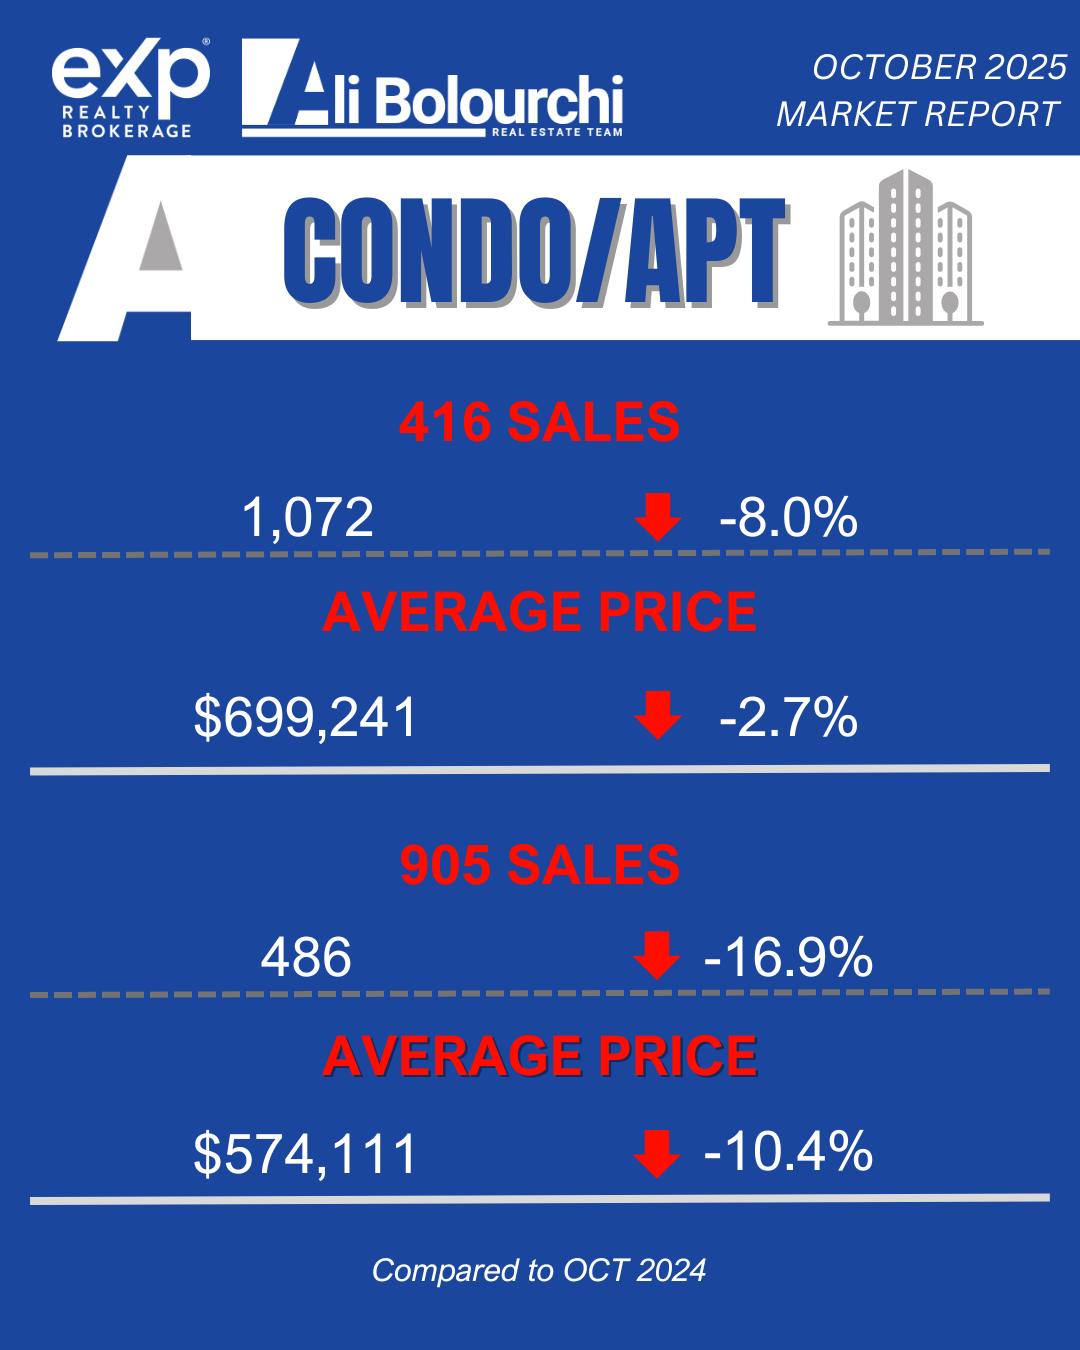
Condo apartments are the most accessible form of homeownership in the GTA. The segment is demonstrating broad, consistent demand, with sales up 7.2% across the region.

  • High Volume. Strong sales at a relatively high price point reflect continued appetite for urban living and investment.

  • Best Value. The strongest sales growth and a lower average price point highlight the superior affordability and increasing supply outside the core.

  • For Investors: The condo market is key. High sales volume combined with softening prices and a robust rental market makes this segment ripe for long-term investment and rental yield.

Conclusion

The September 2025 market is defined by a burst of buying activity, primarily driven by the Bank of Canada's decision to ease borrowing costs. The worst of the market correction is likely behind us, and we are now seeing different sectors and regions stabilize and rebound at varying speeds.

The 416 core is showing remarkable price resilience in detached homes, while semi-detached and townhouses are experiencing explosive sales growth as buyers prioritize location and value. Meanwhile, the 905 remains the overall affordability engine for the entire region.

The time to act is now! The market is re-engaging, and two more 25-basis-point interest rate cuts are anticipated to further spur sales and related economic activity. Waiting for the "official" bottom could mean waiting for competition to return in force.

Don't miss the window of opportunity where buyers still have choice and leverage. Contact us today for a detailed, custom-fit strategy for your specific home type and area!

Bottom Line: Toronto East is in a Seller’s Market for premium detached properties right now! If you're a buyer, you need an aggressive, hyper-local strategy. If you're a seller, your listing window is wide open!

#TorontoRealEstate #GTARealty #TorontoEast #416Homes #SellerMarket #BuyerStrategy #RealEstateInvestment #TRREBStats #September2025

Read

Ontario's Housing Starts Crisis: What the 26% Failure Rate Means for Landlords and Future Rental Supply

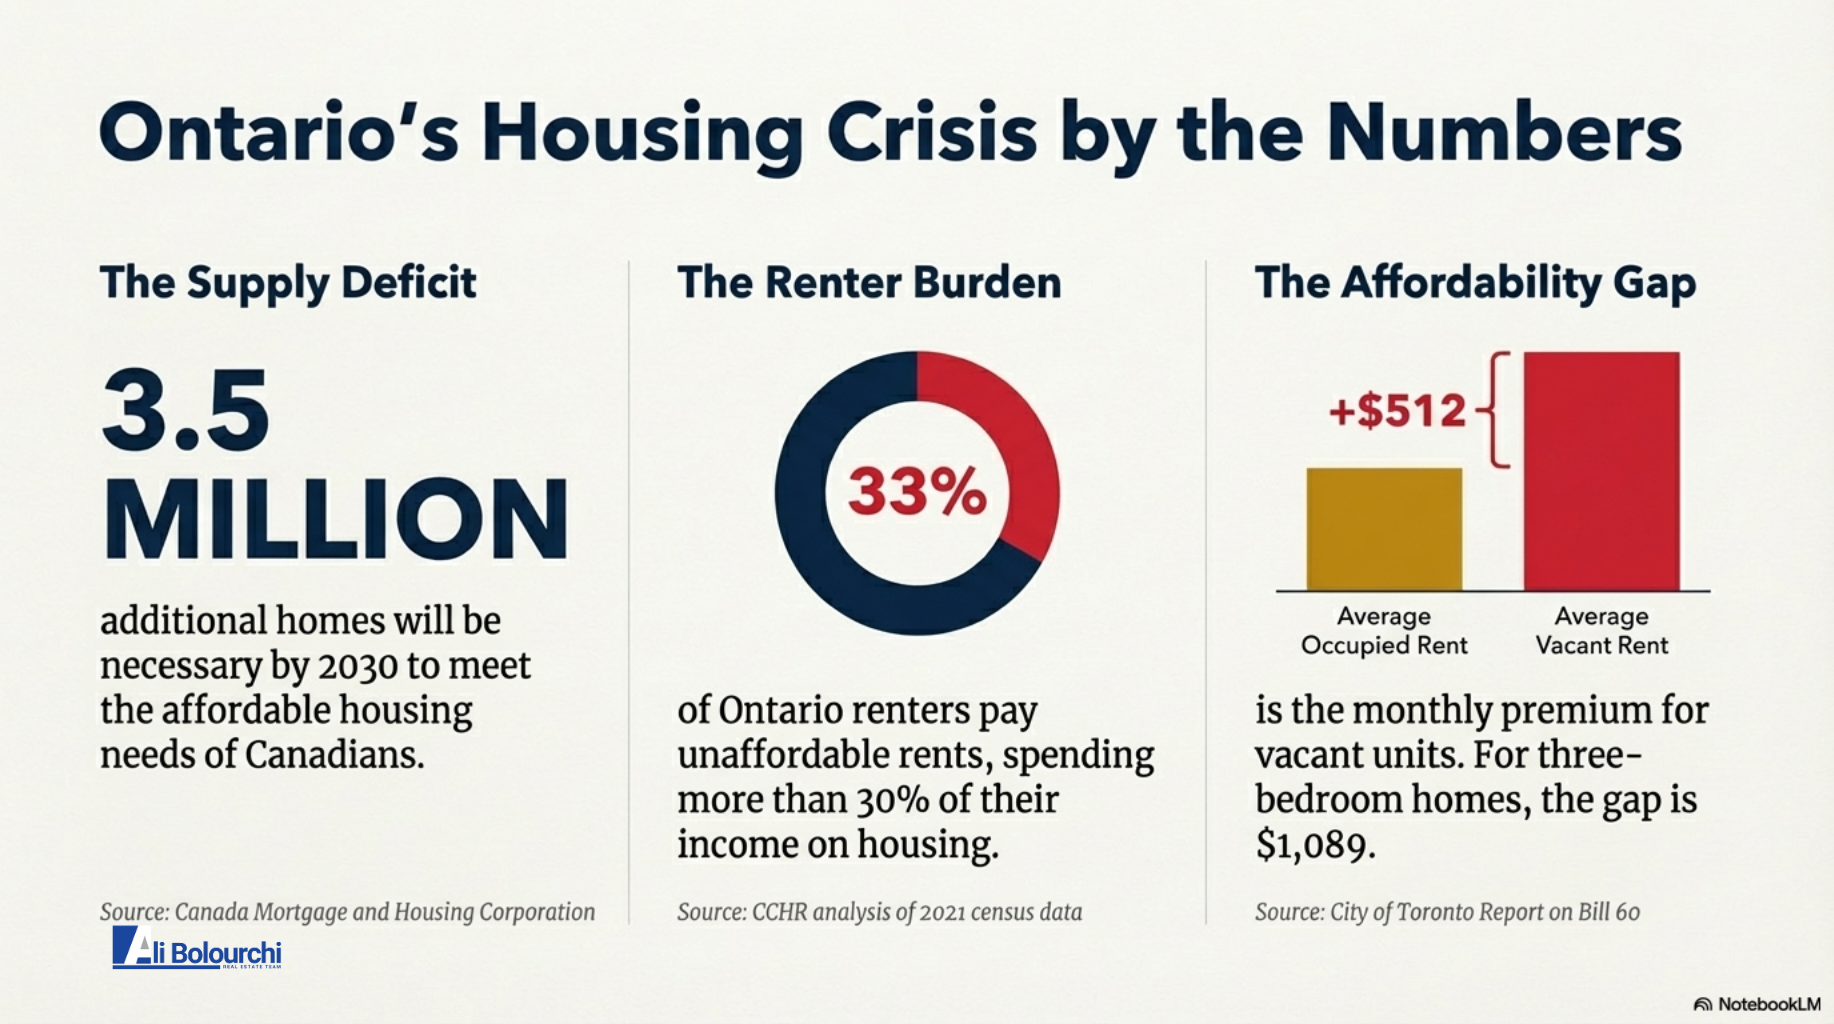
It was the headline that stopped the development community cold: Ontario is currently on track to hit only 26% of its annual housing target, with housing starts down by a staggering 23% compared to last year. While politicians debate the semantics, the reality is simple: the promise to build 1.5 million homes by 2031 is now facing a severe, multi-year failure. For investors and current landlords in the Greater Toronto Area (GTA), this isn't just a political talking point—it's a fundamental shift in market dynamics. The crisis in supply means two things are now certain: competition for existing rental units will remain brutal, and the value proposition of owning income property in Southern Ontario has become exponentially stronger.


The Shocking Data: Unpacking the 26% Failure Rate

The provincial goal is ambitious: deliver 150,000 new homes annually to meet the 1.5 million target. However, the economic and political realities of 2025 have driven a deep contraction in new construction. Recent figures from the Canada Mortgage and Housing Corporation (CMHC) and local boards reveal a stark misalignment between policy ambition and construction reality.

The Policy Promise vs. The Ground Reality

The latest statistics confirm that Ontario is the major outlier in Canada. New construction activity is slowing dramatically, placing the province far behind its national peers.

Province/RegionYear-Over-Year Change in Housing StartsPolicy Status
Ontario (Focus) 23%On track for 26% of annual target
British ColumbiaUnchangedStable, but struggling with density
Saskatchewan 50%+Strong growth due to affordability

The failure rate of 26% translates directly into hundreds of thousands of missing homes in the future, guaranteeing the fundamental imbalance between housing demand and housing supply will persist for years.

Why Builders Are Hitting the Brakes (The Investor's POV)

This deep contraction in new supply is driven by financial risk and uncertainty, forces that strategic investors must understand to predict long-term gains.

Cost, Risk, and the Rate Conundrum

  • The High Cost of Capital: Despite the Bank of Canada recently cutting the overnight rate to 2.5%, the cost of capital for massive, multi-year construction loans remains high. This makes large-scale projects financially unviable without aggressive pre-sales, leading to what is effectively a "builder strike" where projects are delayed or cancelled.

  • Political and Economic Uncertainty: Lingering global economic risks (such as trade war tariffs on building materials) combine with federal changes to immigration targets—a key driver of rental demand—to create too much volatility. Developers, facing higher material costs and uncertain future demand, are taking a "wait-and-see" approach.

  • Municipal Red Tape: Despite provincial efforts, developers still cite chronic delays with permits, approvals, and development charges as core reasons why projects stall, turning three-year plans into five-year nightmares.


The Investor's Advantage: Rental Market Pressure Cooker

The crisis in the ownership market has a powerful, long-term effect on the rental sector. Fewer homes being built today mean guaranteed scarcity tomorrow.

Rental Demand: The Permanent Squeeze

While the rental market has experienced a slight softening in advertised rates in some newer condo segments, the underlying demand for occupied units remains ferocious. This highlights a momentary oversupply of new units, not an overall easing of tenant demand.

Unit Type (City of Toronto)Average Asking Rent (Q3 2025 Approx.)YOY % Change (Asking)YOY % Change (Occupied)
1-Bedroom Apartment/Condo$2,135 4-5% 9.5%
2-Bedroom Apartment/Condo$2,795 3-7% 10.7%
Investor TakeawayCoolingFierce

Existing Property Values: Scarcity as a Premium

  • Freehold Insulation: The massive contraction in housing starts is focused on high-density condos. This lack of new low-rise construction makes existing freehold properties with income suite potential (e.g., legal duplexes/triplexes) an increasingly rare and valuable asset, insulated from the condo market's pricing volatility.

  • Rising Yields: The data clearly shows that actual rental income from occupied units continues to grow aggressively (up 9.5% to 10.7% YOY for Toronto). This confirms that rental cash flow will continue to support high property valuations for strategic investors.

Conclusion: The Long-Term Bet on GTA Supply Failure

The lack of political success in meeting housing targets guarantees that high demand will continue to collide with critically low inventory for years to come. For the strategic investor, this failure is not a problem; it's a long-term economic catalyst. The income-generating properties that exist today are gold-plated assets in a market where new supply is proving impossible to deliver at scale.

Actionable Takeaways for Stakeholders:

  • Investors: View any current market flatness as an opportunity to acquire units that will command premium rents and equity gains due to the inevitable, prolonged supply shortage. Focus your search on high-yield properties with multi-unit potential.

  • Landlords: Tenant retention is critical. The cost of vacancy is now higher than ever. Review your portfolio for potential legal conversions (duplex, garden suite) to maximize the income stream from your existing asset.

  • Buyers (General): While some detached home prices may be flat, the long-term solution (supply) is failing, meaning holding any form of residential property remains a vital wealth-building strategy.

  • Developers/Builders: Re-evaluate land holdings. Smaller, infill projects utilizing flexible provincial legislation (Missing Middle) may be the most viable path forward to navigate financing constraints and permitting friction.

Ready to Capitalize on the Supply Crisis?

Don't let market headlines confuse you. This is the time to act with a clear, data-driven plan to acquire or optimize income property.

  • Book a Strategy Session: Let's review your investment goals against this new supply data to pinpoint the most resilient income properties in the GTA.

  • Access the Right Data: We use MLS® access and data tools to find properties that meet the stringent criteria for high-yield, conversion-ready investment.

Book Your Investor Strategy Session Book Now

Contact Us for Data-Driven Property Matches 

Read

The Two-Family Mortgage: How Co-ownership is Redefining the First-Time Buyer Dream in the GTA

When the average home in the Greater Toronto Area (GTA) is priced well over a million dollars, the dream of homeownership can feel like a fairy tale. You’ve crunched the numbers, saved diligently, and still, the down payment looks like climbing Mount Everest. The good news? The path to the closing table no longer has to be a solo journey. The market is evolving, and the Two-Family Mortgage—or strategic property co-ownership—is quickly becoming the smartest financial handshake in Southern Ontario. Forget renting; imagine combining forces with a trusted friend, sibling, or extended family member to conquer unaffordability and start building equity now. This isn't just splitting the bills; it's a strategic, data-driven move that is fundamentally changing who can afford to own in Canada’s hottest market.

The Unspoken Crisis: Why The GTA Needs Co-Ownership

The Real Cost of Waiting: Inventory and Rate Pressure

The numbers don't lie. Recent reports from the Toronto Regional Real Estate Board (TRREB) show the average home price in the GTA hovering around $1.02 to $1.07 million. This figure creates an impossible "catch-22" for first-time buyers:

  1. High Rates: Bank of Canada rates have lowered buying power, increasing the monthly carrying cost.

  2. High Prices: Stubbornly low inventory keeps prices elevated, especially for desirable family-sized homes.

If your household income qualifies you for a mortgage of $500,000, but the entry-level home you want is priced at $900,000, the gap is massive. This is where co-ownership becomes the essential bridge from renter to owner. It’s the strategy that allows two or more incomes and savings pools to meet the market where it stands.

📊 GTA Housing vs. First-Time Buyer Income (2020–2024)

Sources: Home price data from Fivewalls and Precondo; income estimates based on historical CRA and CMHC reports.

🔍 Key Insights

  • 🏠 Home prices peaked in 2022, driven by pandemic-era demand and low interest rates.

  • 💼 First-time buyer incomes rose slowly, averaging ~2–3% annual growth.

  • ⚠️ The price-to-income ratio consistently exceeds 12×, far above the recommended 3–5× range for affordability.

This widening gap makes solo ownership nearly impossible without significant financial support, dual incomes, or inheritance. If you'd like, I can help visualize this in a graph or explore affordability scenarios based on mortgage rates and down payments.

How Co-Ownership Works: Two Paths to Ownership

When two or more non-spousal parties buy a property in Ontario, they must choose one of two legal structures. The choice is critical as it dictates financial flexibility and, most importantly, the exit strategy.

Tenants-in-Common (The Investment Strategy)

This structure is common for friends, siblings, or investment partners who contribute unequal amounts of capital.

  • Definition: Each party owns a specific percentage of the property (e.g., Person A owns 60%, Person B owns 40%).

  • Key Feature: There is NO Right of Survivorship. If one owner dies, their share goes to their estate, which is then distributed according to their will, not automatically to the surviving co-owner(s).

  • Target: Ideal for partners with differing financial contributions who need flexibility for estate planning.

Joint Tenancy (The Family/Lifestyle Strategy)

This is the standard for married or common-law couples but can work for close family members.

  • Definition: All owners are viewed as owning one whole property together with equal rights and responsibilities. Shares must be equal (e.g., 50/50 for two owners).

  • Key Feature: The Right of Survivorship is mandatory. If one owner dies, their share automatically passes to the surviving owner(s), bypassing the will and avoiding probate.

  • Target: Best for partners buying with the intent of long-term residence who want the ownership transfer to be seamless upon death.


The Financial Edge: Doubling Your Buying Power

The most immediate benefit of a Two-Family Mortgage is the turbocharge it gives your financial application.

The Down Payment Advantage: Combining Savings

Combining two or three dedicated savings accounts instantly fast-tracks your ability to reach the crucial 20% down payment threshold. By avoiding Canadian Mortgage and Housing Corporation (CMHC) insurance fees, co-owners can save tens of thousands of dollars right off the top, making the property instantly more affordable and improving monthly cash flow.

Qualifying Power: The Two-Income Mortgage

Lenders assess co-ownership mortgages using the combined debt-to-income ratios of all parties on the title. A single buyer with an annual salary of $80,000 might qualify for a $369,000 mortgage. But two co-owners, one earning $80,000 and the other $65,000, combine their incomes to qualify for a much larger mortgage—potentially over $668,000—effectively placing a semi-detached or townhouse firmly within their reach.

Generated Image

The Co-Ownership Agreement: The Critical Legal Shield

The biggest mistake co-owners make is relying on a handshake. No matter how strong the relationship, a detailed, legally-binding Co-Ownership Agreement (COA) is non-negotiable. Think of it as the pre-nup of real estate.

Defining the Exit Strategy

The COA must clearly address what happens when one owner wants to move on. This includes:

  • Right of First Refusal: The remaining owner(s) get the first chance to buy out the departing partner's share.

  • Valuation Method: How will the property be appraised to determine the fair market value of the share? (e.g., Agreed-upon appraiser, average of three appraisals, etc.)

  • Forced Sale Clause: Under what conditions can a partner compel the sale of the entire property if a buy-out is not feasible?

Defining Day-to-Day Operations and Expenses

Clarity prevents conflict. The COA must outline:

  • Expense Split: How are property taxes, utility bills, mortgage payments, and insurance costs split? (It doesn't always have to be 50/50).

  • Capital Improvements: Who pays for major renovations like a new roof or furnace, and how do those contributions change the equity split (if structured as Tenants-in-Common)?

  • Dispute Resolution: A mechanism for mediation or arbitration before resorting to costly legal action.


Conclusion: The Future of Ownership in Southern Ontario

The landscape of GTA real estate demands innovation, and co-ownership is the market's most pragmatic answer. It’s a powerful, tangible tool for building equity and stability that was previously locked away by six-figure price tags. It’s time to get strategic with your closest network.

Actionable Takeaways for Stakeholders:

  • Buyers (First-Time Home Buyers/Families): Stop waiting for prices to drop. Start talking to a trusted family member or friend about pooling resources. Get a lawyer and a mortgage broker experienced in co-ownership before you start house hunting. Your fastest route to ownership is through partnership.

  • Sellers (Existing Homeowners): The rise of co-ownership expands your potential buyer pool. Your property, especially larger homes with income suite potential or distinct living spaces, is now appealing to multiple groups purchasing together, which can generate competitive offers and potentially higher sale prices.

  • Investors/Landlords: Look at co-purchasing larger, multi-unit properties (duplexes/triplexes) with a capital partner under a Tenants-in-Common agreement. This allows you to scale your portfolio faster by accessing high-priced assets that can generate multiple rental streams.

  • Tenants: Co-ownership is your fastest route out of the rental market. View your trusted roommate or family member as a potential business partner who can help you ditch rent payments and start growing generational wealth.

Ready to Turn Two Incomes into One Home?

Co-ownership is a sophisticated financial strategy that demands expert guidance. You need more than just a real estate agent; you need a team that understands the legal, mortgage, and market mechanics of a shared purchase.

Don't risk your future with a handshake agreement!

  • Book a Co-Ownership Consultation: Let's sit down with a dedicated mortgage specialist and real estate lawyer referral to structure your Two-Family Mortgage for success. Book Your Strategy Session Here!

  • Download Our FREE Co-Ownership Checklist: Get the essential 10-point checklist covering legal, financial, and emotional decisions you must make with your co-owner partner before submitting an offer in the GTA.

Book Your Strategy Session Here!

Read

The BoC Just Made Its Move: What the 2.5% Interest Rate Means for GTA Buyers and Your Path to Homeownership!

The moment we've all been waiting for is finally here! This morning, the Bank of Canada announced a 25 basis point reduction to its overnight rate, bringing it down to a new target of 2.5%. For many prospective homeowners in the Greater Toronto Area, this isn't just a news headline; it's the official signal that a new, more encouraging chapter is beginning in the real estate market. This is the first rate cut since March, and its timing is a deliberate move to stimulate an economy showing signs of weakness and to keep inflation in check.

This is a powerful development because it directly impacts the cost of borrowing and, by extension, your ability to get into the market. After a period of careful consideration, the Bank of Canada determined that with a softer economy and contained inflation, it was the right time to reduce rates to help balance the scales. The era of relentless rate hikes is officially over, and we are now in a phase where monetary policy is shifting to support economic activity.

What This Means for GTA Buyers: Your Opportunity Has Arrived

For many prospective homeowners in the GTA, this rate cut could be the catalyst you've been waiting for. It’s a direct boost to your buying power and can make the difference between a dream home being within reach or just a distant goal. Here’s a breakdown of the impact:

  • Increased Affordability: A lower interest rate means your mortgage payments will be smaller. Even a 0.25% drop can translate into significant savings over the life of a mortgage, making monthly payments more manageable and easing the financial burden of homeownership.

  • Boosted Buying Power: Lower rates mean you can qualify for a larger mortgage amount with the same income. This could open up new possibilities and allow you to consider a larger home or a more desirable neighbourhood that was previously out of your price range.

  • Renewed Market Momentum: This rate cut is a signal that the market is beginning to normalize. It’s likely to bring more buyers who have been sitting on the sidelines back into the market, increasing activity and confidence. This can lead to a more balanced and predictable market where both buyers and sellers have a clearer sense of value.

Comaprison

  • Mortgage Amount: $800,000

  • Amortization Period: 25 Years

  • Please note: The following calculations are based on the Prime Rate, which the Bank of Canada's overnight rate directly influences. The recent 25 basis point cut lowers the Prime Rate from 4.95% to 4.70%.

ScenarioInterest RateMonthly Payment
Before Rate Cut4.95% (Prime Rate)$4,630.93
After Rate Cut4.70% (New Prime Rate)$4,484.07

The Impact on GTA Sellers: A Growing Pool of Buyers

Sellers have every reason to be optimistic as well. An influx of newly qualified and motivated buyers into the market is a huge advantage. As affordability improves, the pool of potential buyers for your property expands. This increased demand can lead to more competition for desirable homes, which could result in stronger offers and potentially shorter listing times. A line graph showing the recent trend of active listings and sales volumes in the GTA, with a forward-looking prediction, would visually demonstrate this expected uptick in market activity.

Predictions for Investors and Landlords: A Strategic Play

For investors and landlords, this rate cut presents a strategic opportunity. Lower financing costs directly improve your cash flow and can make it more affordable to finance new investment properties or refinance existing ones. As market activity picks up, the potential for capital appreciation on well-located properties also increases, offering a dual benefit of improved cash flow and long-term equity growth.

Conclusion: Seize the Moment and Make Your Move

The Bank of Canada's decision to lower the overnight rate is a landmark event for the GTA real estate market. It's a clear signal of a new era, one defined by increasing stability and renewed opportunity. For buyers, this is the moment to act. The market is poised for a positive shift, and being proactive can put you in a position to secure your dream home with more favourable financing.

Call to Action: The time to strategize is now. Whether you're a first-time homebuyer or looking to upgrade, understanding how this rate cut impacts your personal financial situation is crucial. Contact us today to discuss your goals and create a plan to capitalize on this new market momentum.

Read

The Price Puzzle: Beyond Toronto's Borders, Where Does Your Money Go Further?

Welcome, future homeowner! 🏡 When you start your real estate journey in the GTA, your first thought is probably to look at Toronto. But here's a secret that savvy buyers are already learning: the most expensive places to buy a home aren't always in the city's downtown core. As urban life has shifted, so has real estate value, with several surrounding municipalities now boasting higher average prices than the city itself.

This blog post will arm you with the data you need to make an informed decision. Let's look at how Toronto's prices stack up against its most valuable neighbours and uncover where you might find your dream home.

The New Real Estate Hotspots: A Data-Driven Look

The search for more space, a backyard for the kids, and a quieter street has driven buyers to the 905 area code. This high demand has transformed communities like Vaughan, Markham, and Richmond Hill into some of the most sought-after (and pricey!) markets in the country. Their excellent schools, amenities, and community feel have made them a premium choice, which is reflected in the prices.

Average Home Prices: Toronto vs. the GTA

To truly understand this trend, we need to compare the average prices of a typical home across these regions. While the overall GTA average price has seen some adjustments, the relative value of properties in these specific areas remains exceptionally high.

While Toronto has a high average price, cities like Vaughan and Richmond Hill are right on its heels. This demonstrates that moving just outside the city doesn't guarantee a lower price point, especially if you're looking for a single-family home.

A Closer Look: Breaking Down the Market

Let's dive a little deeper and examine the average price by property type. This will give you a more granular view of what your money can buy in each market.

CityDetached HomeSemi-Detached HomeCondo Apartment
Toronto~$1.42M~$1.09M~$642K
Vaughan~$1.2M+~$1.1M~$700K
Markham~$1.1M+~$1.1M~$750K
Richmond Hill~$1.16M+~$980K+~$700K+

Note: Data is based on recent market trends and subject to change.

As the table shows, if you're a buyer seeking a detached or semi-detached home, you'll find that prices in Vaughan, Markham, and Richmond Hill are very competitive with Toronto's, and in some cases, even higher. This is a crucial detail to remember when you're setting your budget and searching for properties.

Your Action Plan: How to Buy Smart in This Market

Navigating this complex real estate landscape requires a strategic approach. Here are some key takeaways for you as a buyer:

  • Be Flexible with Location: Don't limit your search to just Toronto. Broaden your horizons and look at desirable suburbs. You might find a better fit for your lifestyle, even if the price is similar.

  • Work with a Local Expert: A local real estate agent who specializes in these specific markets can be an invaluable asset. They have their finger on the pulse of neighbourhood-level trends and can guide you to opportunities that might not be obvious.

  • Adjust Your Expectations: Understand that "affordable" is a relative term in the GTA. Instead of focusing solely on the lowest price, focus on the best value for your money—considering factors like community, schools, and commute.

  • Stay Informed: The market is constantly changing. Keep an eye on new listings and market reports to understand price movements and inventory levels. A market with a high number of listings can give you more negotiating power.

Conclusion

The GTA real estate market is full of surprises, and the idea that Toronto is always the most expensive is one of the biggest myths. By understanding the true value and price dynamics of the surrounding areas, you can become a much more powerful and confident buyer. Your dream home might be waiting just outside the city limits, but be prepared for a competitive and valuable market. 🏡

Read

GTA Home Prices Dip, But Sales Tick Up: A Deep Dive into the 416 vs. 905 August Market Stats

August 2025: A Tale of Two Real Estate Markets in the GTA 🏡

The Greater Toronto Area's real estate market in August 2025 presented a fascinating story of subtle shifts and clear opportunities. While the overall picture shows home prices continuing to adjust, a closer look at the data reveals a market that's more nuanced than you might think, especially when we compare the City of Toronto (416) to the surrounding regions (905). This month's report is a must-read for anyone looking to make a move, whether you're a first-time buyer, a seasoned seller, or an astute investor.

Key Market Highlights for August 2025

August saw a modest increase in home sales year-over-year, with 5,211 transactions reported through the TRREB MLS® System—a 2.3% jump from August 2024. This uptick in sales is happening even as the average selling price across the GTA saw a 5.2% year-over-year decrease to $1,022,143. The elevated choice in the market, with new listings up by 9.4% to 14,038, is giving buyers more power in negotiations.

  • Average Selling Price: Down 5.2% year-over-year to $1,022,143.

  • Total Sales: Up 2.3% year-over-year, with 5,211 homes sold.

  • New Listings: Up 9.4% year-over-year, reaching 14,038.

This data confirms a trend where buyers benefit from a well-supplied market, which is a significant change from the highly competitive environment we've seen in recent years.


The 416 vs. the 905: A Closer Look at Market Dynamics

To understand the GTA market, it's crucial to break down the data by region. The City of Toronto (416) and the surrounding areas (905) are showing different patterns, which offer unique opportunities for different types of properties.

Detached Homes

  • 905 Region: The 905 saw the majority of detached home sales, with 1,875 transactions in August 2025. The average price for a detached home in this region was $1,251,686, which is a 6.9% decrease from the same time last year.

  • 416 Region: The City of Toronto saw 536 detached home sales at an average price of $1,524,066. This represents a 10.0% year-over-year decrease in price.

Semi-Detached Homes

  • 905 Region: With 284 sales, the 905 market for semi-detached homes showed a 4.4% year-over-year decrease in sales, and prices were down 4.9% to an average of $896,407.

  • 416 Region: The City of Toronto had 157 semi-detached sales, experiencing a notable 18.0% year-over-year increase in transactions. The average price was $1,131,498, a modest 6.1% decrease from last year.

Townhouses

  • 905 Region: Townhouse sales in the 905 were up slightly by 0.8% with 741 transactions, but the average price was down 5.1% to $846,289.

  • 416 Region: The 416 saw a 9.4% increase in townhouse sales, with 186 homes changing hands. The average price in this segment actually ticked up by 1.0% year-over-year to $915,511, showing resilience in this property type.

Condo Apartments

  • 905 Region: Condo apartment sales in the 905 were down 7.7% year-over-year, with 479 transactions. The average price decreased by 10.6% to $594,881.

  • 416 Region: The City of Toronto, the condo hub, saw a 3.4% year-over-year drop in sales (890 units) and a 2.0% decrease in average price to $667,660.

Actionable Takeaways for the GTA Real Estate Market

For Sellers

The market is currently well-supplied, which means you have to be strategic to stand out. Pricing your property competitively from the start is more important than ever. Avoid the trap of overpricing, which can lead to longer days on market and force you to negotiate downward. The data shows that the average sale price is 97% of the average list price across the TRREB area, highlighting that most homes are selling for slightly under their asking price. This is an ideal time to work closely with your real estate professional to set a price that attracts serious buyers and gets your home sold efficiently.

For Buyers

This is an incredible time to be in the market. The increased inventory means more selection and less competition, giving you a chance to find the perfect home without the pressure of bidding wars. Use the current market conditions to your advantage by being prepared with your financing and making a strong, well-researched offer. With selling prices lower than last year and the potential for a future interest rate cut from the Bank of Canada, your purchasing power could improve even more.

For Investors

The condo market presents a compelling opportunity. While average prices are down, a well-supplied market means you have a great selection to choose from. The softening in the resale market is causing some owners to turn to the rental market, but in core areas, the rental market remains strong. This creates a potential sweet spot for investors looking to acquire units at a better price point while benefiting from stable rental income. Look for well-located condo apartments in the 416 region, where prices are down but the long-term demand for rental units remains high.

Conclusion

The August 2025 TRREB market data paints a clear picture: this is a buyer's market. With higher inventory and moderating prices, the power has shifted. While sellers may need to adjust their expectations, strategic pricing can still lead to successful outcomes. For buyers and investors, this is the time to act decisively and take advantage of the best selection and negotiation opportunities we've seen in a long time. The market may be in a period of adjustment, but for those who are prepared and informed, it's filled with potential.

Is there any other specific data you would like to explore or a different angle you'd like to take for the blog post?

  • How are the different regions within the 905, such as York or Peel, performing for specific home types?

  • Could we do a deep dive into the Months of Inventory and Sales-to-New-Listings Ratio to better explain the market balance to readers?

  • Would you be interested in an analysis of the luxury home market ($2,000,000+) in the GTA, based on the August data?

Read

The New Normal: How the Bank of Canada's 2% Target Anchors the GTA Housing Market Against Global Shocks

In a world full of rapid changes and economic uncertainty, everyone is looking for a little stability. For those of us navigating the dynamic real estate landscape of the Greater Toronto Area (GTA), a recent announcement from the Bank of Canada provides just that: a solid foundation upon which to build your future. The central bank has confirmed it will not change its 2% inflation target in the upcoming 2026 monetary policy framework renewal.

This isn't just a dry economic decision; it's a powerful statement that has direct and positive implications for every buyer, seller, and investor in the GTA. It signals a "new normal" where the framework for a healthy, predictable housing market is firmly in place, even when the world around us feels unpredictable.

What Does a 2% Inflation Target Actually Mean?

To understand the significance, let's break down the basics. Inflation is the rate at which the general price of goods and services rises, and it erodes your purchasing power. Think of it this way: what a dollar buys today might buy less tomorrow. The Bank of Canada’s primary job is to control this, keeping it at a stable 2% midpoint within a 1-3% range. They do this by adjusting the policy interest rate, also known as the overnight rate.

The key is this: the 2% inflation target is the long-term goal, not a fixed interest rate. The policy interest rate is the tool they use to reach that goal. The recent decision to stick with the 2% target shows their confidence in this system and its ability to act as a crucial anchor for long-term economic planning. While the overnight rate will still move up or down based on economic conditions, its movements will be aimed at a clear, consistent objective.

The Direct Impact on the GTA Real Estate Market

So, how does this commitment to a stable inflation target affect the Greater Toronto Area's real estate? The effects are significant and far-reaching.

Mortgage Rates and Affordability

The central bank's policy rate directly influences the prime lending rate offered by commercial banks. When the Bank of Canada holds its course on a stable inflation target, it reduces the risk of sudden, aggressive interest rate hikes driven by a fear of runaway inflation. This predictability is a huge win for homeowners and buyers.

  • For Fixed-Rate Mortgages: The stability of the overall economic outlook helps keep long-term bond yields, which influence fixed mortgage rates, from experiencing wild swings. This allows you to lock in a rate with greater certainty about future borrowing costs.

Suggested Visualization: A line graph showing the Bank of Canada's policy interest rate and the average 5-year fixed mortgage rate over the last five years. The graph would highlight periods of volatility and then show how the rates are now settling into a more stable pattern, guided by a predictable inflation target.

A Deep Dive into Variable-Rate Mortgages: The New Strategic Advantage

The conversation around variable-rate mortgages has shifted dramatically. In a market where the Bank of Canada's direction is clear, choosing a variable rate is no longer just a gamble—it's a strategic decision.

A variable-rate mortgage is quoted as "Prime Rate plus or minus a discount." When the Bank of Canada changes its overnight rate, banks adjust their Prime Rate, and your mortgage interest rate moves with it. Here’s why this is so important right now:

  • Benefit from Rate Cuts: If the Bank of Canada begins to lower rates to stimulate the economy, your variable rate—and thus the interest portion of your payment—will drop with it. This allows you to benefit from a falling rate environment without having to renegotiate or break your mortgage.
  • Lower Penalties: Variable-rate mortgages typically come with a much lower penalty to break the term (often just three months' interest) compared to a fixed-rate mortgage. This flexibility is invaluable if your life plans change and you need to sell or refinance.

  • Convertibility: Most variable-rate mortgages have a "convert" feature that allows you to lock in to a fixed rate at any time, usually without a penalty. This gives you the best of both worlds: the potential for savings in a falling-rate environment and the option to switch to the security of a fixed rate if you become uncomfortable with fluctuations.

This is the key takeaway: while the overnight rate can still move, the Bank of Canada's firm commitment to a 2% inflation target means that any rate changes will be deliberate and part of a measured strategy, not an unpredictable reaction. This provides a level of certainty that makes a variable mortgage a powerful tool for sophisticated borrowers.

Property Values and Investor Confidence

In times of high inflation, real estate is often seen as a hedge—a safe place to park money as prices rise. However, that can lead to speculative bubbles and unsustainable growth. A stable, low-inflation environment encourages a more rational and sustainable appreciation in property values.

  • Steady, Sustainable Growth: The 2% target promotes a market where property values grow at a healthy, more predictable pace, rather than experiencing a boom-and-bust cycle. This protects the equity of existing homeowners and makes the market more accessible to new entrants.

  • A Magnet for Investors: This kind of stability is a massive draw for both domestic and international investors. They can forecast returns and plan their portfolios with a clearer picture of the economic future, reinforcing the GTA as a premier destination for real estate investment.

The GTA Market in a Global Context

Canada is part of a global economy, and we feel the effects of international events, from supply chain disruptions to geopolitical tensions. The Bank of Canada's decision provides a critical shield. By maintaining a clear and credible domestic policy, the central bank helps to buffer the Canadian economy—and by extension, the GTA real estate market—from external shocks.

This unwavering approach gives our market a competitive advantage. It builds international confidence, making the Canadian dollar and Canadian assets, including real estate, even more attractive to global capital looking for a safe haven.

What This Means for You

The Bank of Canada's commitment to its 2% inflation target is more than just a headline; it's a guidepost for your real estate journey.

  • For Buyers: This is your signal for stability. While rates can still move, the overarching goal is clear. Use this period to get pre-approved and plan your home search with a clear understanding of your borrowing costs. The "new normal" means you can make a purchase with more confidence and less risk.

  • For Sellers: While the frantic pace of past years has slowed, the market is fundamentally strong. This predictable environment ensures that your property's value is well-supported and a clear advantage to prospective buyers.

  • For Investors and Landlords: The stability allows for more accurate forecasting of returns and rental income. You can confidently expand your portfolio, knowing that the underlying economic framework supports long-term, sustainable growth. For tenants, this stability can lead to more predictable rent increases, taking some of the guesswork out of their future housing costs.

The Bank of Canada’s decision anchors our market, turning a period of uncertainty into an opportunity for strategic action.

Read

Will the Bank of Canada Cut Rates in September? The Case for a Rate Hold.

The Inflation Conundrum: Below Target, But Is it Sustainable? 🎯

The latest inflation numbers are a headline-grabber, with Canada's CPI at 1.7% as of July 2025. This is well below the Bank's 2% target. However, the Bank's Governing Council is likely to look past the headline figure and focus on the underlying pressures. The moderation in inflation is largely due to the temporary effect of the carbon tax removal and a continued decline in gasoline prices. If you strip out volatile items like food and energy, core inflation is still a concern. This presents a dilemma for policymakers: while the headline number looks great, the persistence of underlying price pressures hasn't fully dissipated, particularly with high shelter costs.

A Mixed Bag of Economic Signals 📉⬆️

The broader economic picture is a mixed bag, which strongly supports a cautious, wait-and-see approach.

  • GDP Contraction: The most recent data from the Canadian Federation of Independent Business (CFIB) suggests a significant contraction, with Canada's GDP growth rate estimated to have fallen by -0.8% in the second quarter of 2025. This indicates a slowing economy that would typically call for a rate cut to stimulate growth.

  • Weak Labor Market: Canada's unemployment rate is elevated at 6.9% as of July 2025. The latest job numbers showed a significant loss of full-time positions, indicating building slack in the labor market.

  • A Softening Housing Market: The Teranet-National Bank Composite House Price Index confirms that the housing market continues to soften, with prices down for a sixth consecutive month in July, falling -0.8% m/m. This is a direct result of higher borrowing costs and has a dampening effect on economic activity.

External Pressures and the US Fed 🇺🇸

The Bank of Canada cannot act in a vacuum. The US economy and monetary policy are key factors. The US Fed Funds Rate currently sits at 4.33%, with the US Inflation (CPI) at 2.4%. The Bank of Canada must consider the potential for capital flight and the impact on the USD/CAD exchange rate if its policy diverges too sharply from the US Federal Reserve. A significant rate cut in Canada while the Fed holds steady could weaken the loonie, making imports more expensive and potentially fueling inflation down the line.

MARKET RATES

  • US 10Y Treasury Yield: 4.29% (as of Aug 20, 2025)

  • 10YT Minus 2YT Spread: 0.48% (as of June 20, 2025)

  • US 30-Year Fixed-Rate: 6.90%

  • US Prime Rate: 7.50%

  • Canada Prime Rate: 4.95%

  • US Fed Funds Rate: 4.33% (Effective Federal Funds Rate, as of Aug 19, 2025)

  • Policy Interest Rate - Bank of Canada: 2.75% (as of July 30, 2025)

  • SOFR: 4.28% (as of March 1, 2025)

  • US Inflation (CPI): 2.4% (as of May 2025)

  • CA Inflation (CPI): 1.7% (as of July 2025)

  • USD/CAD Exchange Rate: $1 USD = $1.37 CAD

  • S&P 500: 6,025.04

  • Gold: $3,376.02 USD/t.oz (Canadian equivalent: $4,624.18 CAD/t.oz)

  • Lumber: $608.50 USD per 1,000 board feet

  • Crude (WTI): $69.70 USD/Bbl

  • Gasoline USD/Gal: $2.21 USD/Gal

  • Global Container Freight Index: 1,869.59 points

  • Bitcoin: $103,413 USD (Canadian equivalent: $144,348.07 CAD)

  • Ethereum: $2,307.45 USD (Canadian equivalent: $3,296.84 CAD)

  • Luxury Watch Index: $33,557 (Note: This is a composite. For specific brands: Rolex +45.31%, Patek Philippe +82.10% since January 2019)

  • CANADIAN ECONOMIC & REAL ESTATE INDICES

  • Canada GDP Growth Rate (Quarterly): -0.8% (Q2 2025 estimate)

  • Canada Unemployment Rate: 6.9% (July 2025)

  • Canada Household Debt-to-Income Ratio: 174% (Q1 2025)

  • Canada Consumer Confidence Index (Conference Board of Canada): 52.9 points (May 2025, down 4.5 points)

  • Canada Housing Affordability Index (RBC Aggregate): 59.5% (Q2 2024, representing share of median household income needed to cover homeownership costs)

  • Canada Rental Vacancy Rate: 3% (2025 forecast, CMHC data)

  • Teranet-National Bank Composite House Price Index (Canada): 311.02 (July 2025, -0.8% m/m)

  • Canadian Home Builders' Association (CHBA) Housing Market Index (HMI) - Single-Family: 26.4 (Q1 2025 - builder confidence, 0-100 scale, below 50 indicates more builders rate conditions as "poor")

  • Canadian Home Builders' Association (CHBA) Housing Market Index (HMI) - Multi-Family: 22.3 (Q1 2025 - builder confidence)

The Verdict: A Cautious Hold 🤝

Given the conflicting signals, the most likely outcome is that the Bank of Canada will opt for a rate hold on September 17th. While the weak GDP and elevated unemployment rate argue for a cut, the persistent underlying inflation and the need to maintain some alignment with US monetary policy are likely to give policymakers pause. A hold allows the Bank to assess the full impact of these variables and avoid a premature move that could jeopardize their progress on inflation. A hold is a message of "stay the course", allowing them to gather more data and make a more informed decision at a later meeting, possibly in October or December.

Read

Transit-Oriented Investments: How GTA Subway Extensions and Fast-Tracked Housing Corridors Will Reshape Demand and Pricing

Introduction

Investing near transit isn’t just about convenience; it’s about strategic growth. Properties within a 10-minute walk of a subway or LRT stop have a history of commanding significant premiums, attracting long-term tenants, and outperforming the broader market. As the Greater Toronto Area (GTA) accelerates both its transit expansion and housing approval processes, understanding where the biggest upside lies is key for savvy investors.

The Big Picture: Policy & Scale

The Ontario government has introduced aggressive policies to combat the housing crisis by tying development directly to transit infrastructure. The plan is to create 1.5 million new homes over the next decade, with a specific focus on developing higher-density communities around 120 major transit station areas. This "Transit-Oriented Communities" initiative aims to:

  • Unlock Vast Swaths of Land: By simplifying zoning and approving higher-density permissions, the plan opens up previously low-rise or under-utilized land for multi-unit projects.

  • Fast-Track Approvals: With shortened timelines and a focus on ministerial zoning orders (MZOs), the approval process for new projects is being streamlined. This allows builders to start construction faster and, crucially, allows early investors to capture price appreciation before mass construction begins.

Key Projects to Watch

While several projects are underway, here is a look at three major extensions poised to redefine their respective communities.

Transit LineArea(s)Stations AddedExpected CompletionEstimated Daily Ridership
Yonge North Subway ExtensionRichmond Hill, Markham, Vaughan5203094,000
Eglinton East LRT ExtensionScarborough–Rouge Park2202830,000
Finch West LRT Phase 2North York1202915,000

Data Source: Metrolinx & TTC public records. The Eglinton East LRT is a City of Toronto-led project that still requires full funding for construction to proceed beyond the design phase. The Finch West LRT is in its final stages of testing and commissioning.

A map showing the Yonge North Subway Extension

Number of stations

Five

Proposed connections to other transit options

Up to seven:

  • Richmond Hill GO train service
  • Highway 407 GO bus service
  • York Region Viva Highway 7 bus rapid transit
  • York Region Viva Yonge Street bus rapid transit
  • Future Highway 407 Transitway service
  • Future TTC Steeles Avenue rapid transit service
  • Local York Region and TTC bus service

Route length

~8 km

Ridership

More than 94,100 daily boardings

Travel time savings

Up to 22 minutes

Improved access to transit

More than 26,000 more people living within walking distance to a station

Improved access to jobs

More than 22,900 employees within walking distance to a station

Reductions in traffic congestion

A reduction of more than 7,700 km in vehicle kilometres traveled during morning rush hour

Yearly reductions in greenhouse gas emissions

More than 4,800 tonnes

Data Source: Metrolinx & TTC public records.

Emerging Hotspots for Early Investors

The most significant gains are often found in areas that are not yet established, but where new transit is a confirmed catalyst. Here are some key areas to watch:

  • North York (Steeles West Station): While the Finch West LRT is expected to be operational in late 2025, the area surrounding the new Steeles West Station remains a hotspot for early investors. Similar projects have shown historic price growth in the 8%–12% range. New mid-rise condo projects here offer a significant price advantage over comparable downtown units.

  • Richmond Hill Centre: As the Yonge North Subway Extension takes shape, Richmond Hill Centre is positioned as the new "urban growth centre" for the region, with planned office and retail space. The market is already responding, and an investment here is a bet on the long-term vision of a new downtown core.

  • Markham–Unionville: The Yonge North extension will connect Markham directly to the subway system, a first for the city. This provides an instant link to major tech and corporate campuses. With strong demand, upcoming mixed-use nodes are projected to offer strong rental yields, making them attractive to both investors and end-users.

  • Vaughan Metropolitan Centre (VMC): As an already established transit hub, VMC provides a powerful case study. Since the subway extension opened in 2017, average resale condo prices have seen substantial appreciation, underscoring the long-term impact of new transit. With further intensification planned, the momentum is expected to continue.

Pricing & Demand Dynamics

The impact of transit is quantifiable. A 2022 study by the C.D. Howe Institute found that properties within 500 meters of a new transit stop could see a value premium of up to 10-25% over properties further away.

For pre-construction, the opportunity is even more pronounced. Early-stage pricing for VIP access to pre-construction projects often offers a significant discount compared to final market value. By securing a deposit on these units, investors can lock in strong equity gains before the building is completed and fully integrated into the transit network.

  • Properties within 500 m of transit: Historical premiums of 10%–25%.

  • Early pre-construction pricing: Typically sits 20%–30% below end-value.

Actionable Investment Strategies

  1. Secure Pre-Launch Units: Leverage relationships with brokers who have access to "Platinum" and "VIP" sales events to get the best pricing and selection before a project is launched to the general public.

  2. Conduct Due Diligence: Go beyond the glossy brochures. Audit final station alignment maps, check shadowing studies, and confirm local zoning changes to ensure the project aligns with your long-term vision.

  3. Plan Your Exit: The best returns are often realized in the 3- to 5-year hold period, as the project nears completion and the full benefit of transit service becomes apparent to the market.

  4. Diversify Your Asset Mix: Consider combining low-rise townhomes for steady cash flow with pre-construction condos for rapid price appreciation.

Next Steps

The GTA is undergoing a fundamental shift in its urban planning, and transit-oriented development is at the heart of this change. This is a chance to invest not just in real estate, but in the future of our communities.

To learn more, which section would you like us to explore in greater detail?

  • Detailed neighborhood profiles with real-life comparables

  • A deep dive on zoning changes and fast-track approvals

  • Sample financial models illustrating hold periods and ROI

Read

Greater Toronto Area Real Estate Market: July 2025 Market Report

Welcome to the July 2025 market report for the Greater Toronto Area! This month's data from the Toronto Regional Real Estate Board (TRREB) shows a dynamic and evolving market. After experiencing a slight slowdown, we're seeing signs of renewed strength, with home sales marking the best July performance since 2021. A combination of improved affordability from lower home prices and borrowing costs is drawing more buyers into the market, suggesting a modest tightening in market conditions compared to last year.

Overall Market Summary 📊

The GTA real estate market in July 2025 saw an increase in both sales and new listings compared to the same period last year. This growth points to an active market with buyers demonstrating a greater willingness to transact5. While prices are slightly lower year-over-year, the month-over-month trend suggests a flattening.

  • Home Sales: A total of 6,100 homes were sold in July 2025, which is a significant 10.9% increase compared to the 5,498 sales in July 2024.

  • Average Selling Price: The average selling price was $1,051,719, down by 5.5% compared to July 2024. On a month-over-month seasonally adjusted basis, the average selling price remained flat compared to June.

  • New Listings: New listings entered into the MLS® System totaled 17,613, up by 5.7% year-over-year.

  • Days on Market: The average days a listing spent on the market increased from 24 days in July 2024 to 30 days in July 2025. This suggests properties are taking a bit longer to sell despite the rise in sales.


In-Depth Look by Major Home Type 🏠

Here's a breakdown of how different property types performed across the GTA in July 2025.

Detached Homes

Detached homes saw a solid increase in sales, with 2,795 transactions. The average price for a detached home was $1,361,660, though this marks a 5.1% year-over-year decrease.

  • City of Toronto: The average price for a detached home was significantly higher at $1,572,832, with 675 sales15.

  • 905 Regions: The average price was $1,294,424, with 2,120 sales16.

Semi-Detached Homes

This segment experienced the largest growth in sales, with transactions up 25.5% year-over-year to 596 units.

  • Average Price: The average price was $1,041,359, a modest 2.3% decrease from July 2024.

  • City of Toronto: Average prices were $1,242,388, with a significant year-over-year sales increase of 48.2%.

  • 905 Regions: Average prices were lower at $894,094, but sales still grew by 12.8%.

Townhouses

Townhouse sales saw a 7.9% year-over-year increase, with 1,047 sales in July 2025.

  • Average Price: The average price was $849,380, down 7.4% from the previous year.

  • City of Toronto: Average prices were $920,197.

  • 905 Regions: Average prices were $829,332.

Condominiums

The condo market showed signs of recovery with a 5.8% increase in sales to 1,576 units.

  • Average Price: The average price was $651,483, representing a 9.3% year-over-year decrease.

  • City of Toronto: Average prices were $684,257 with 1,028 sales.

  • 905 Regions: Average prices were lower at $590,004, with 548 sales and a robust 10.7% year-over-year sales increase.


What This Means for Buyers and Sellers in the GTA 💡

The July 2025 data paints a picture of a more active and dynamic market than we've seen recently. For both buyers and sellers, an informed and strategic approach is more critical than ever.

Advice for Sellers:

  • Strategic Pricing is Key: The market has not fully reverted to a seller's market30. With more new listings and an average of 30 days on the market for a sold home, pricing your property correctly from day one is essential to avoid it becoming stale. Chasing the market with an overpriced listing will likely lead to longer days on market and potential price reductions.

  • Focus on Presentation: Your home needs to stand out from the increased inventory. Professional staging, high-quality photography, and a strong marketing strategy are crucial to attracting serious buyers and achieving your desired price.

Advice for Buyers:

  • Increased Opportunity: The rise in new listings and the higher number of active listings (30,215 active listings in July 2025, up from 23,936 in July 2024) mean you have more choice. While sales are up, there's less frantic competition than in previous years, which could offer you more time to find the right property.

  • Leverage Economic Indicators: Keep an eye on economic indicators like the Bank of Canada's overnight rate and mortgage rates. Improved affordability brought about by lower prices and borrowing costs is a key factor driving sales. Understanding these trends can help you time your purchase effectively.

Ready to Navigate the Market with Confidence? 🚀

Whether you are looking to buy, sell, or invest, understanding these detailed trends is the first step. The right strategy can make all the difference in this shifting market.

Let's discuss how these insights apply to your unique real estate goals. We can help you create a personalized plan to achieve the best possible outcome.

📞 Contact us at 416-886-2000 to book a consultation today! 🏡✨

Read

Navigating the Tides: How a Steady Rate and Tariff Winds Shape Canada's Economy and GTA Real Estate

The Bank of Canada has spoken, and for the third consecutive time, the overnight rate remains at 2.75%. This "no change" decision offers a glimmer of stability in what has become an increasingly choppy economic landscape. But as we look at the broader picture, particularly with the persistent gusts of the U.S. tariff war, it's clear that Canada's economy and, by extension, the Greater Toronto Area's (GTA) real estate market are navigating complex currents.

The Calm in the Rate Storm

For many Canadians, the steady overnight rate is a welcome pause. If you have a variable-rate mortgage or a line of credit, your payments aren't changing for now. This predictability allows households and businesses to plan with a bit more confidence, avoiding the immediate squeeze of rising borrowing costs. It also offers a stable footing for those looking to enter the housing market, providing a clearer picture of their potential mortgage payments.

The Headwinds of Tariffs

However, the stillness from the Bank of Canada contrasts sharply with the blustery reality of the tariff war with our biggest trading partner, the United States. This isn't just a distant political squabble; its effects are rippling through every corner of the Canadian economy:

  • Slower Growth: Experts are predicting a challenging few quarters, with some even forecasting negative GDP growth for Q2 and Q3 2025. Industries reliant on cross-border trade, particularly manufacturing, are feeling the pinch.

  • Rising Costs: Those tariffs aren't just numbers on a spreadsheet; they're showing up in the prices of goods. Businesses, anticipating future duties, are already raising prices, contributing to stubbornly elevated core inflation.

  • Job Uncertainty: Layoffs are creeping into sectors hit hard by the trade disputes, leading to a dip in consumer confidence and a tighter job market.

GTA Real Estate: A Balancing Act

So, how does this play out in the bustling GTA real estate scene?

On one hand, the stable interest rate is a positive. It means:

  • Mortgage Predictability: Buyers can lock in rates with a sense of security, helping them budget more effectively.

  • Seller Opportunity: A steady rate can attract more serious buyers who feel comfortable making offers, potentially leading to more competitive sales for sellers.

But the tariff war casts a long shadow, directly impacting the very supply of homes in the GTA:

  • Construction Crunch: Our homebuilders are facing a double whammy: higher costs for essential materials like steel, lumber, and appliances, and unreliable supply chains. This means projects are being delayed, new builds are becoming more expensive, and some developers are even hitting the pause button entirely. This only worsens the already critical housing supply shortage, especially for the family-friendly freehold properties that are in such high demand.

  • Cautious Buyers: The overall economic uncertainty has made buyers more discerning. They're more likely to walk away if prices aren't justified, and investor interest, particularly in smaller condos, has cooled.

  • Mortgage Renewal Reality Check: Many homeowners who locked in ultra-low fixed rates a few years ago are now facing significant payment jumps as their mortgages come up for renewal. Even with stable rates, this creates financial stress for a substantial portion of the population, which could indirectly impact the broader market.

The Road Ahead

The Bank of Canada is playing a careful hand, aiming to maintain stability while monitoring the complex interplay of inflation and trade disruptions. While the current rate holds offer a much-needed steady hand for mortgage holders, the tariff war presents an undeniable challenge to Canada's economic growth and the delicate balance of the GTA's housing market.

As we move forward, the focus remains on how these external pressures evolve and how the Canadian economy, and particularly its housing sector, adapts to these ongoing headwinds. For anyone in the GTA real estate market – whether buying, selling, or building – staying informed and adaptable will be key.

Read

Beyond the Numbers: Trade Tensions, Inflation, and the Bank of Canada's Tightrope Walk

As July draws to a close, all eyes in Canada turn to Wednesday, July 30th. It's decision day for the Bank of Canada (BoC), and while the official announcement on the target for the overnight rate will be swiftly delivered, the accompanying Monetary Policy Report (MPR) will offer crucial insights into the central bank's updated economic outlook. This particular decision is steeped in complexity, as the BoC navigates sticky inflation, a softening domestic economy, and perhaps most significantly, the persistent and escalating threat of US-Canada trade tariffs.

The Economic Landscape: A Mixed Picture

Canada's economic picture heading into this decision is, at best, a mixed bag.

Inflation: The headline Consumer Price Index (CPI) has eased, with the latest data for May showing it held steady at 1.7% year-over-year. This is below the BoC's 2% target, partly due to the effects of the federal carbon tax removal and moderating shelter costs. However, the BoC's preferred core measures of inflation (CPI median and trimmed mean) remain elevated, averaging 3.0% in May, indicating that underlying price pressures are still present, particularly in services.

Economic Growth: After a stronger-than-expected Q1 2025 GDP growth of 2.2% (annualized), which was boosted by exports and inventories, the Q2 picture looks considerably weaker. Preliminary estimates for May indicate a 0.1% decline in real GDP, suggesting the Canadian economy is losing momentum as the pre-tariff boost (from "tariff frontrunning") dissipates and other headwinds take hold.

Labour Market: The Canadian labour market showed an unexpected sign of resilience in June, with the unemployment rate edging down to 6.9%. This broke a five-month streak of deterioration and defied some expectations. However, this improvement was largely driven by part-time employment, and long-term unemployment remains elevated, hinting at underlying structural weaknesses. Consumer confidence also remains subdued, with the latest June reading at 48.8 points, indicating continued caution among consumers.

Here's a snapshot of key Canadian economic data:

IndicatorValue (as of specified date)Trend/Context
Canada GDP Growth Rate (Quarterly)2.2% (Q1 2025 annualized)Q2 tracking closer to flat/slight decline after Q1 export boost.
Canada Unemployment Rate6.9% (June 2025)Unexpected decline, largely in part-time jobs; long-term unemployment elevated.
Canada Inflation (CPI)1.7% (May 2025)Below target, but core inflation still sticky (3.0% average).
Canada Household Debt-to-Income Ratio173.9% (Q1 2025)Elevated, a persistent vulnerability; edged up from 173.5% in Q4 2024.
Canada Consumer Confidence Index48.8 points (June 2025, up from May's 48.1)Consumers remain cautious, though a slight uptick in June.
Canada Housing Affordability Index (RBC Aggregate)59.5% (Q2 2024)Share of median household income needed for homeownership costs. Still a high hurdle.
Canada Rental Vacancy RateExpected to rise (2025 forecast, CMHC)Signs of increasing turnover, particularly in Ontario.
Teranet-National Bank Composite HPINo updated public data for May 2025Housing market generally softening, recent data showed declines.
CHBA HMI - Single-Family26.4 (Q1 2025)Builder confidence remains low (below 50 indicates "poor" conditions).
CHBA HMI - Multi-Family22.3 (Q1 2025)Builder confidence remains low, near record lows.

The Elephant in the Room: US-Canada Trade Negotiations

While the domestic data presents a challenging puzzle, the shadow of US-Canada trade negotiations looms large over the Bank of Canada's decision. US President Donald Trump has reiterated his stance, stating he does not expect a trade deal with Canada before his August 1st deadline, and has threatened "heavy tariffs" if talks fail. The Commerce Secretary has also confirmed the August 1st deadline for new tariffs is "firm."

Existing US tariffs already include a 25% blanket tariff on certain Canadian goods, 50% on aluminum and steel, and 25% on all non-US-built cars and trucks. The new threat includes a potential 35% tariff on a portion of Canadian goods not covered by the existing North American trade pact (USMCA).

How do these trade tensions affect the Bank of Canada's calculus?

  • Inflationary Pressure vs. Economic Slowdown: This is the BoC's primary dilemma. Tariffs are inherently inflationary, as they raise the cost of imported goods and can lead to higher domestic prices as businesses pass on increased input costs. However, they are also a significant drag on economic growth, as reduced exports and weakened business investment weigh on activity.

    • The BoC's Q2 Business Outlook Survey and Canadian Survey of Consumer Expectations (referenced in their June MPR) revealed that businesses intend to pass on tariff costs, and consumers expect higher prices.

    • A significant drop in exports, particularly in the highly integrated auto sector and other trade-intensive industries, could lead to job losses and reduced household income.

  • Supply Chain Disruptions: The highly integrated supply chains between the two countries mean that tariffs can increase production costs and prices for a wide range of goods that cross the border multiple times as intermediate inputs.

  • Uncertainty: The ongoing uncertainty itself is a negative economic factor, leading businesses to postpone investment and hiring decisions, and making consumers more cautious about spending.

The Bank of Canada's Tightrope Walk

The Bank of Canada faces a delicate balancing act. On one hand, persistent core inflation and the potential for tariffs to push up prices further argue against a rate cut. On the other hand, weakening economic growth, the potential for significant job losses from trade disruptions, and slowing consumer spending argue for easing monetary policy.

Most economists anticipate the BoC will hold the policy interest rate at 2.75% at the July 30th meeting. The prevailing sentiment is that the central bank will want to observe the actual impact of any new tariffs and gauge how trade negotiations evolve before making a significant move. A hold would allow them to gather more data and assess the severity and duration of the trade conflict's impact on both inflation and growth.

However, the updated Monetary Policy Report will be scoured for clues. Any changes to their inflation and GDP forecasts, particularly factoring in the trade risks, will signal the Bank's leanings for future decisions. If the trade situation deteriorates significantly and the economic fallout is more severe than anticipated, the door to rate cuts later in the year (e.g., September or beyond) could open wider, despite the inflationary pressures from tariffs. Conversely, if a resolution is reached or the impact is milder, the BoC might remain on a more cautious path.

What Does This Mean for You?

For Canadians, this complex economic environment translates into continued uncertainty.

  • Borrowing Costs: The Canadian Prime Rate remains at 4.95%, directly influenced by the Bank of Canada's policy rate. This means stability for variable-rate mortgages, lines of credit, and other prime-linked loans for now. However, the future trajectory will depend heavily on the trade situation.

  • Inflation and Prices: The threat of tariffs means that despite some moderating in headline CPI, consumers should be prepared for potential price increases on a range of goods, especially if tariffs are broad-based and sustained.

  • Job Market: While the June employment numbers offered a glimmer of hope, the underlying fragility, especially from trade disruptions, suggests the job market could face headwinds in the coming months.

  • Housing Market: Already showing signs of softening, the housing market could continue to see slower activity if economic uncertainty persists and affordability remains a challenge. The RBC Housing Affordability Index (59.5% in Q2 2024) continues to highlight significant challenges for homebuyers.

The Bank of Canada's July 30th announcement will be more than just a rate decision; it will be a crucial assessment of Canada's economic resilience in the face of domestic challenges and escalating global trade tensions. How the BoC communicates its outlook on these intertwined factors will provide vital guidance for businesses and households navigating an uncertain economic landscape.

Read
Categories:   Advise | Services
This website may only be used by consumers that have a bona fide interest in the purchase, sale, or lease of real estate of the type being offered via the website. The data relating to real estate on this website comes in part from the MLS® Reciprocity program of the PropTx MLS®. The data is deemed reliable but is not guaranteed to be accurate.