

Toronto’s September Real Estate Market Overview: Sales, Inventory, and Rents
The Toronto real estate market continues to send mixed signals, with sales and inventory levels shifting in different directions.
Sales Trends
In August, seasonally adjusted home sales in Toronto rose slightly by 0.6% month-over-month (m/m) according to Edge Realty’s September Metro Deep Dive. This was accompanied by a revised upward figure for July. However, year-over-year (y/y) sales were down 6% overall, with the condo segment in the city seeing a sharper decline of 15% y/y. Both the condo and single-family segments had the lowest sales numbers for any August in the past 25 years.

Source: Edge Realty Analytics
New Listings and Inventory Levels
Although there were some expectations for a rise in new listings, seasonally adjusted listings were down 1.6% in August. This continues a trend of lower-than-usual listings over the past 18 months. Active inventory across the Greater Toronto Area (GTA) remains elevated, increasing by 46% y/y and reaching its highest levels since 2008, per the Edge Realty report. Condo inventory, in particular, remains at record highs, adding pressure on market conditions.
The sales-to-new listings ratio remains below 40%, a level historically associated with price declines. Additionally, the months of inventory for condos are at record highs, while single-family homes are at their highest since 2008.


Source: Edge Realty Analytics

Source: Edge Realty Analytics
Market Balance and Price Trends
Despite sales-to-new listings and months of industry numbers, prices have remained stable. The MLS Home Price Index (HPI) remained flat in August, as prices remained effectively unchanged for the past four months. This contrasts with expectations of price declines based on high inventory levels, creating a potential area of future concern. However, Ben Rabidoux, Edge Realty, predicts that without a market tightening before winter, prices could start to decline.
Rental Market and Investor Cash Flow
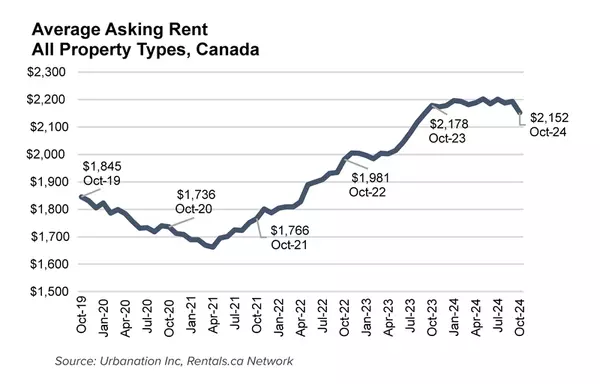
In August 2023, Toronto’s rental market continued its trend of increasing rental prices. The average rent for a one-bedroom unit climbed by 1.4% from the previous month, reaching $2,620, while two-bedroom units saw a 2.4% increase, with average rents hitting $3,413. This positions Toronto as the second most expensive city in Canada for renters, just behind Vancouver.
However, the condo rental market remains under pressure, as the Edge Realy report noted rents dropping 7% y/y in August. This decline is partly attributed to high levels of condo completions. However, cash flow fundamentals for investors have improved somewhat. Falling prices and declining mortgage rates have reduced the monthly cash flow burn rate by more than half compared to late 2023, although it is still negative at this point. Rabidoux anticipates that investors may return by early next year, but only if mortgage rates continue to decline.

Source: Edge Realty Analytics
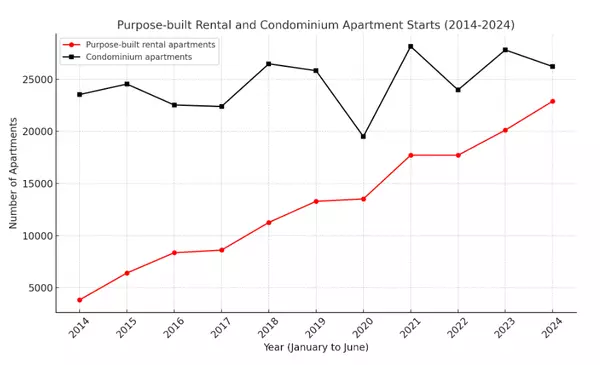
Construction Activity
Rental construction surged in July, resulting in a 1.1% increase in total dwellings under construction in the GTA, largely driven by a 5.5% rise in rental construction. There are 103,000 total dwellings in the construction pipeline, with 73,000 condos and 19,000 rental units under development. However, single-family housing starts remain low, with only 11,000 units in construction. July’s condo sales were notably weak, down 67% y/y, and this will likely lead to fewer condo starts in the coming year, potentially exacerbating future supply shortages, according to the Edge Realty report.

Source: Edge Realty Analytics
Employment and Market Outlook
The economic backdrop has also been challenging. The unemployment rate in the GTA increased to 8.8% in August, the highest level outside of the pandemic since 2012, and higher than Canada’s unemployment rate overall of 6.6%
Looking ahead, the Toronto Regional Real Estate Board (TRREB) expects that lower borrowing costs over the next year and a half will help home buyers by reducing both mortgage payments and home prices. Despite anticipated demand increases in 2025, ample inventory is expected to keep price growth moderate during the initial recovery.
Categories
Recent Posts


GET MORE INFORMATION
