

Toronto Condo Market: Small Gains in June Amidst Broader Weakness
The rate cut in June led to only a slight rise in demand. Seasonally adjusted home sales across the Greater Toronto Area increased by 4.5% month-over-month, breaking a string of four consecutive monthly declines. However, sales remained at the lowest level for any June since 2000, down 16.4% year-over-year, and down 28% in the condo segment, according to Edge Realty Analytic’s July 2024 Metro Deep Dive.


Source: Edge Realty Analytics
New Listings Rise
The report suggests that lower rates are currently impacting sellers more than buyers. Seasonally adjusted new listings jumped by 9.3% month-over-month, with upward revisions to the prior four months. Last month saw the highest number of new listings for any June since 2017. Despite this, the 12-month tally remains below normal levels and is expected to rise, reflecting an “overshoot”, or temporary period of surpassing normal levels or expectations, following 18 months of low activity. The surge in supply is primarily driven by the condo segment, with new listings up 21% year-over-year, the highest June levels since at least 2012.


Source: Edge Realty Analytics
The sales-to-new listings ratio fell to 37%, close to last year’s lows, a level historically consistent with double-digit annual price declines.
Major Resale Inventory Increase
Active inventory increased by 67.4% year-over-year (84% for condos), reaching the highest overall level since 2010. The record supply in the condo market is concerning, as is the significant inventory build in the single-family segment, which includes detached, semi-detached, and townhomes. Supply in this segment surged by 124% over the past three months, the second-strongest increase from March to June in the past 20 years, second only to 2017 following the announcement of the foreign buyer tax.


Source: Edge Realty Analytics
The overall supply-demand balance, as measured by months of inventory, is at the weakest June level since at least 2007, or 2008 for single-family homes, and is the weakest on record for the condo segment. The market balance for condos is unlikely to tighten significantly until investors return in large numbers, which will only happen when cash flows on investment condos break even after considering principal repayment. Although declining prices and interest rates are moving in that direction, the report indicates that condos are still falling nearly $500 per month short.

Source: Edge Realty Analytics
Rapid Price Rise
Notably, despite weak sales and an abundance of inventory, the MLS House Price Index showed a 0.4% seasonally adjusted monthly increase in June, the best performance since mid-last year. However, the report recommends that given the current market dynamics, this reported increase should be viewed with skepticism, as it is unlikely prices will hold firm if current trends persist.

Source: Edge Realty Analytics
Rental Construction Activity Rises
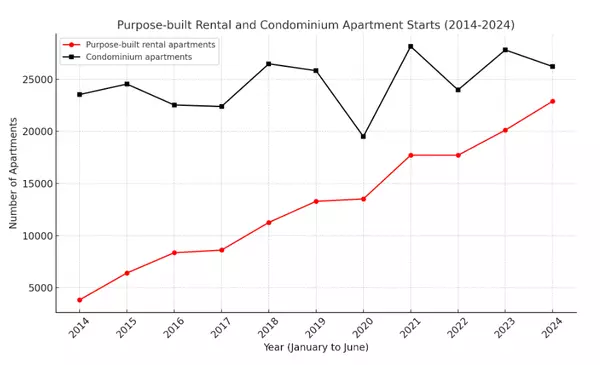
The number of dwellings under construction across the GTA slightly increased in May by 0.6% month-over-month, driven by a 3.0% rise in the rental segment. Single-family dwellings under construction declined by 1.4%, falling now for 13 of the past 14 months. While overall housing starts in Toronto remain solid and were up 26% year-over-year in May, the single-family segment is significantly down, now at less than one-third of the levels seen in the early 2000s. This sets up a key trend for the coming years: an abundance of condos, at least until 2028 when market balance will shift, and a growing shortage of single-family dwellings.
The trend in new home sales, down 71% year-over-year in May and starting the year at the weakest level since at least 2004, suggests a major slowdown in condo starts may be on the horizon.

Source: Edge Realty Analytics
Power of Sale Listings Ease
The report also indicated there were 177 new listings with “power of sale” in the description last month, a slight decrease from May levels.

Source: Edge Realty Analytics
Categories
Recent Posts


GET MORE INFORMATION
