

Ontario Quarterly Market Update: Q2 2024
The Ontario real estate market in Q2 2024 showed signs of a slowdown, with decreases in sales and prices and increases in new and active listings. Furthermore, there was a decline in construction activity. Economic indicators also show a rising unemployment rate.
a recent Edge Realty Analytics report.
Sales
Sales decreased by 7.3% quarter-over-quarter and by 13.3% year-over-year, for a slowdown in market activity compared to both the previous quarter and the same period last year.
Listings
New listings increased by 5.4% quarter-over-quarter and by a notable 21.3% year-over-year.
Active listings also saw a significant increase of 18.0% quarter-over-quarter and 58.3% year-over-year.
Months of Inventory
The months of inventory, or how long it would take to sell existing homes on the market given the current rate of sales, increased from 3.3 in Q1 2024 to 3.8 in Q2 2024.
Sales-to-New Listings Ratio
The ratio decreased from 50.0% in Q1 2024 to 43.5% in Q2 2024.
Prices
Prices experienced a slight decline of 0.1% quarter-over-quarter and a more substantial decrease of 4.6% year-over-year. This downward trend in prices may be reflecting the increased inventory and drop in sales.
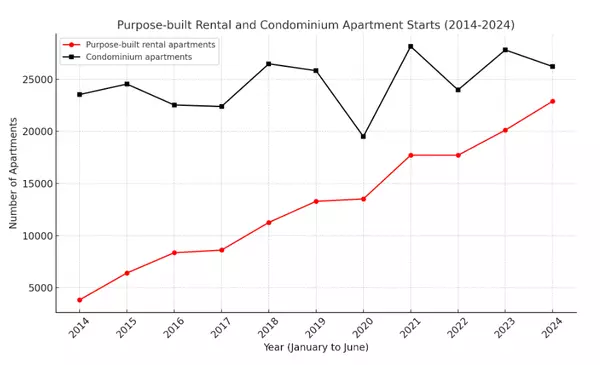
Construction
The number of properties under construction decreased by 3.9% quarter-over-quarter and by 7.5% year-over-year, reflecting a slowdown in new housing projects.
Economic Indicators
Population Growth
Population growth remained steady, with a 0.5% increase quarter-over-quarter and a 3.5% rise year-over-year.
Unemployment Rate
The unemployment rate rose from 6.7% in Q1 2024 to 7.0% in Q2 2024, indicating potential economic challenges that could impact housing affordability and demand. For reference, this is higher than Canada’s unemployment rate overall in June, which was 6.4%.
Mortgage Arrears
Mortgage arrears remained unchanged at 0.13% from Q1 2024 to Q2 2024, suggesting stable financial conditions among homeowners despite other economic pressures.
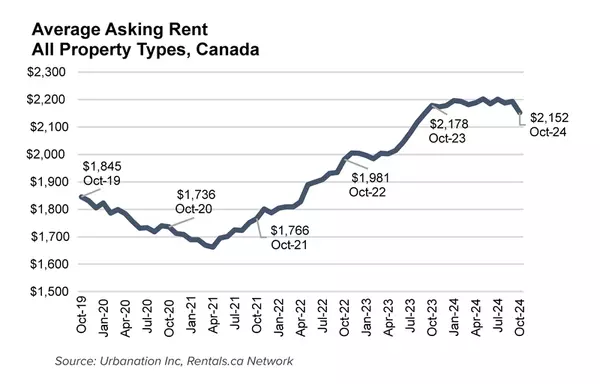
Rentals
As of July 2024, according to Rentals.ca, in Toronto, the average rent for a one-bedroom apartment decreased by 1.4% month-over-month to $2,444, and declined significantly by 4.9% year-over-year. For two-bedroom apartments, the rent fell by 2.6% month-over-month to $3,199, and dropped by 3.1% year-over-year.
In Ottawa, the average rent for a one-bedroom apartment decreased slightly by 0.4% month-over-month to $1,986, and slightly decreased by 0.5% year-over-year. The average rent for a two-bedroom apartment decreased by 0.9% month-over-month to $2,477 but increased notably by 5.6% year-over-year.
In Hamilton, the average rent for a one-bedroom apartment fell by 1.5% month-over-month to $1,780, and decreased significantly by 4.8% year-over-year. The rent for a two-bedroom apartment decreased by 1.6% month-over-month to $2,130, and declined notably by 7.3% year-over-year.
In Kitchener, the average rent for a one-bedroom apartment remained unchanged month-over-month at $1,935, and increased slightly by 2.5% year-over-year. The rent for a two-bedroom apartment decreased by 0.9% month-over-month to $2,327, and slightly decreased by 0.5% year-over-year.
In London, the average rent for a one-bedroom apartment decreased by 0.6% month-over-month to $1,722, and increased slightly by 1.0% year-over-year. The rent for a two-bedroom apartment decreased slightly by 0.5% month-over-month to $2,158, and increased by 3.4% year-over-year.
In Oshawa, the average rent for a one-bedroom apartment increased notably by 3.3% month-over-month to $1,946, and increased by 4.3% year-over-year. The rent for a two-bedroom apartment increased slightly by 0.8% month-over-month to $2,241, and rose notably by 5.6% year-over-year.
Categories
Recent Posts


GET MORE INFORMATION
