


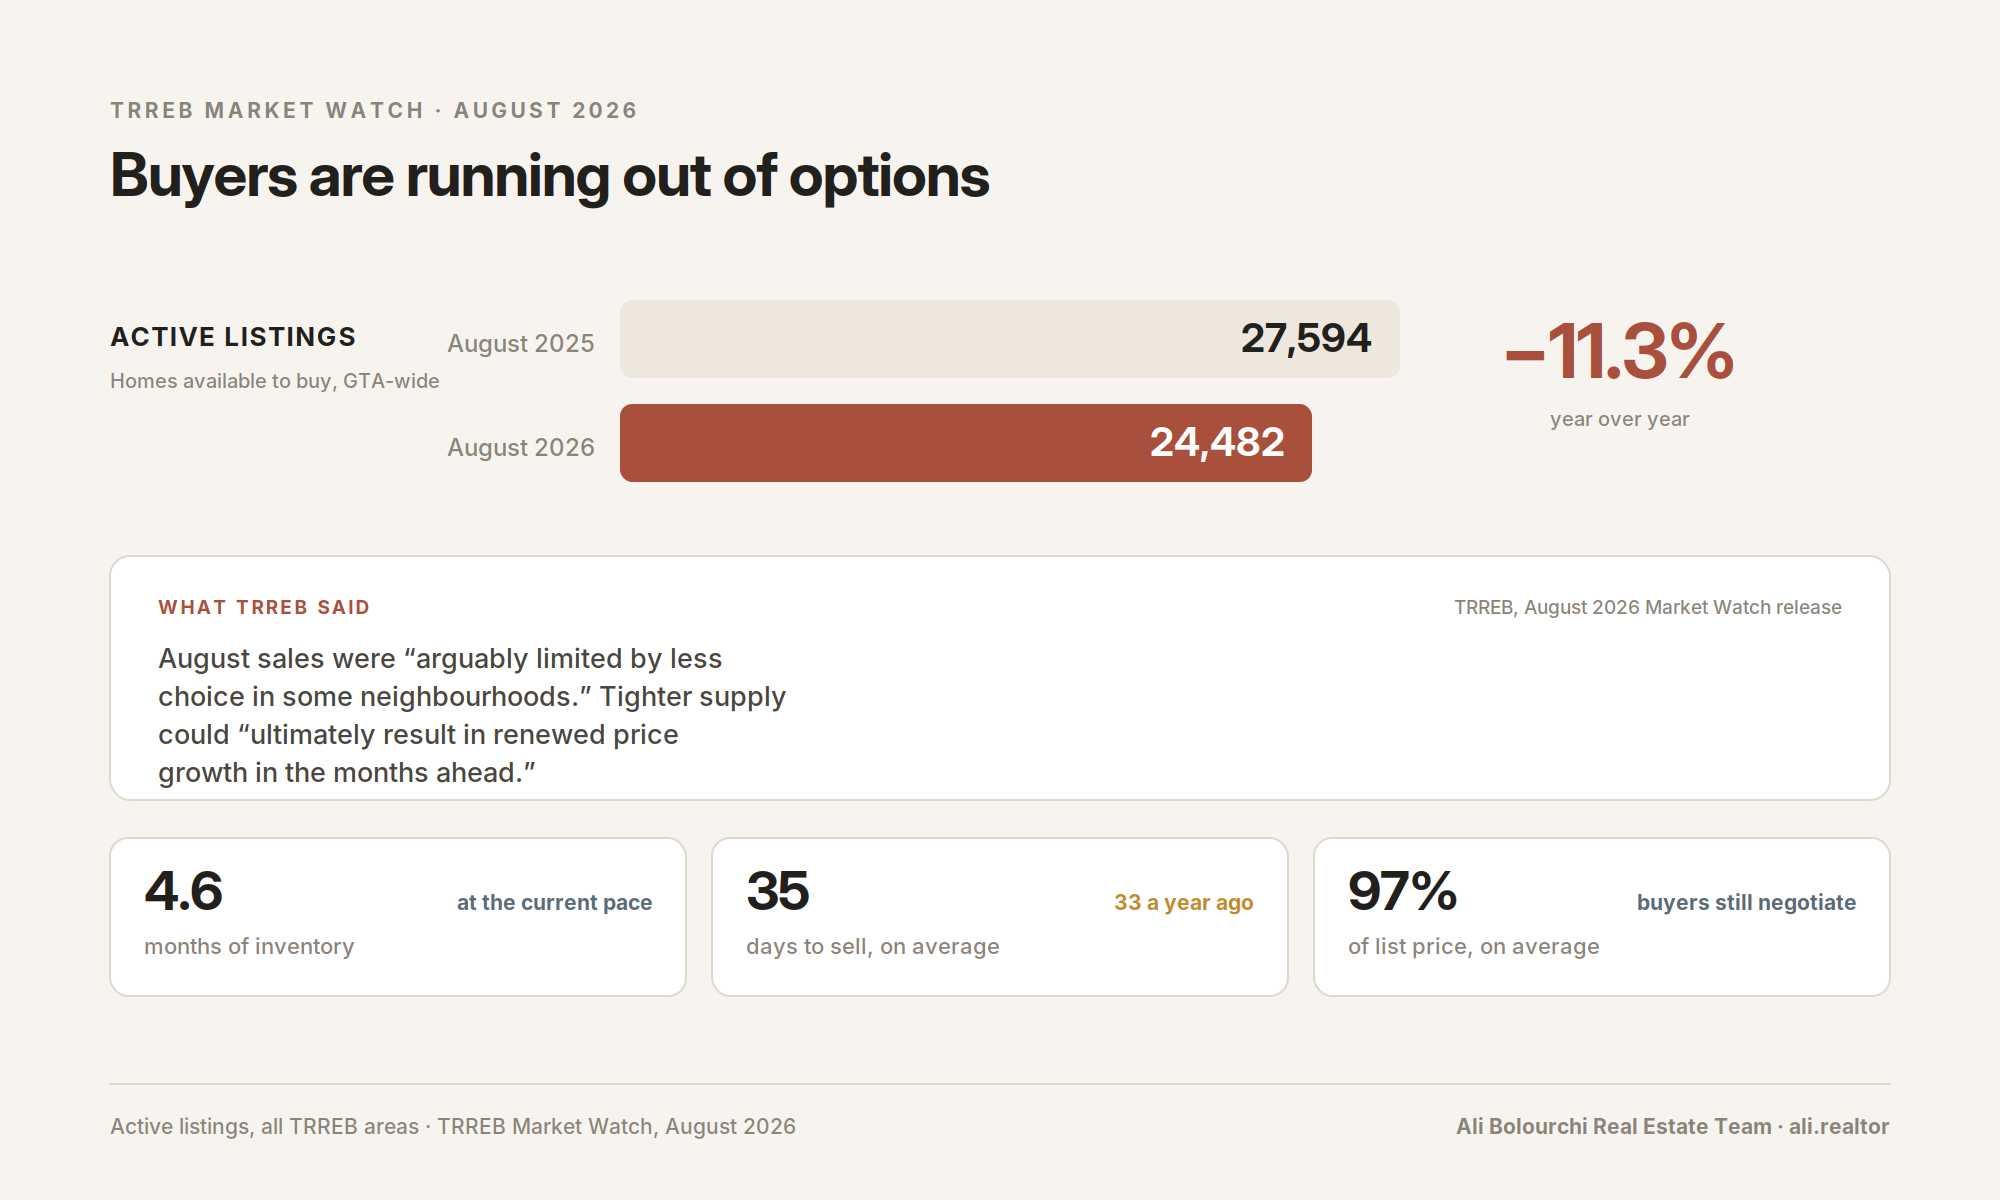
The average GTA selling price came in at $993,410 in August, the first month this year to close below the million-dollar line. On its own that reads like a soft market. Look at the supply side and it reads like the opposite: active listings fell 11.3%, new listings fell 14.1%, and TRREB now says outright that August sales were "arguably limited by less choice in some neighbourhoods."
That is a meaningful shift in language. For most of 2026, thin sales were a demand story. In August, TRREB is telling us buyers wanted to transact and could not find enough to buy. The board went further, saying less choice and more competition between buyers "could ultimately result in renewed price growth in the months ahead."
August 2026 at a Glance
• Home sales: 5,057, down 2.1% year over year (August 2025: 5,168)
• New listings: 12,075, down 14.1% (August 2025: 14,052)
• Active listings: 24,482, down 11.3% (August 2025: 27,594)
• Average selling price: $993,410, down 2.7% (August 2025: $1,021,300)
• MLS HPI Composite: down 4.5% year over year
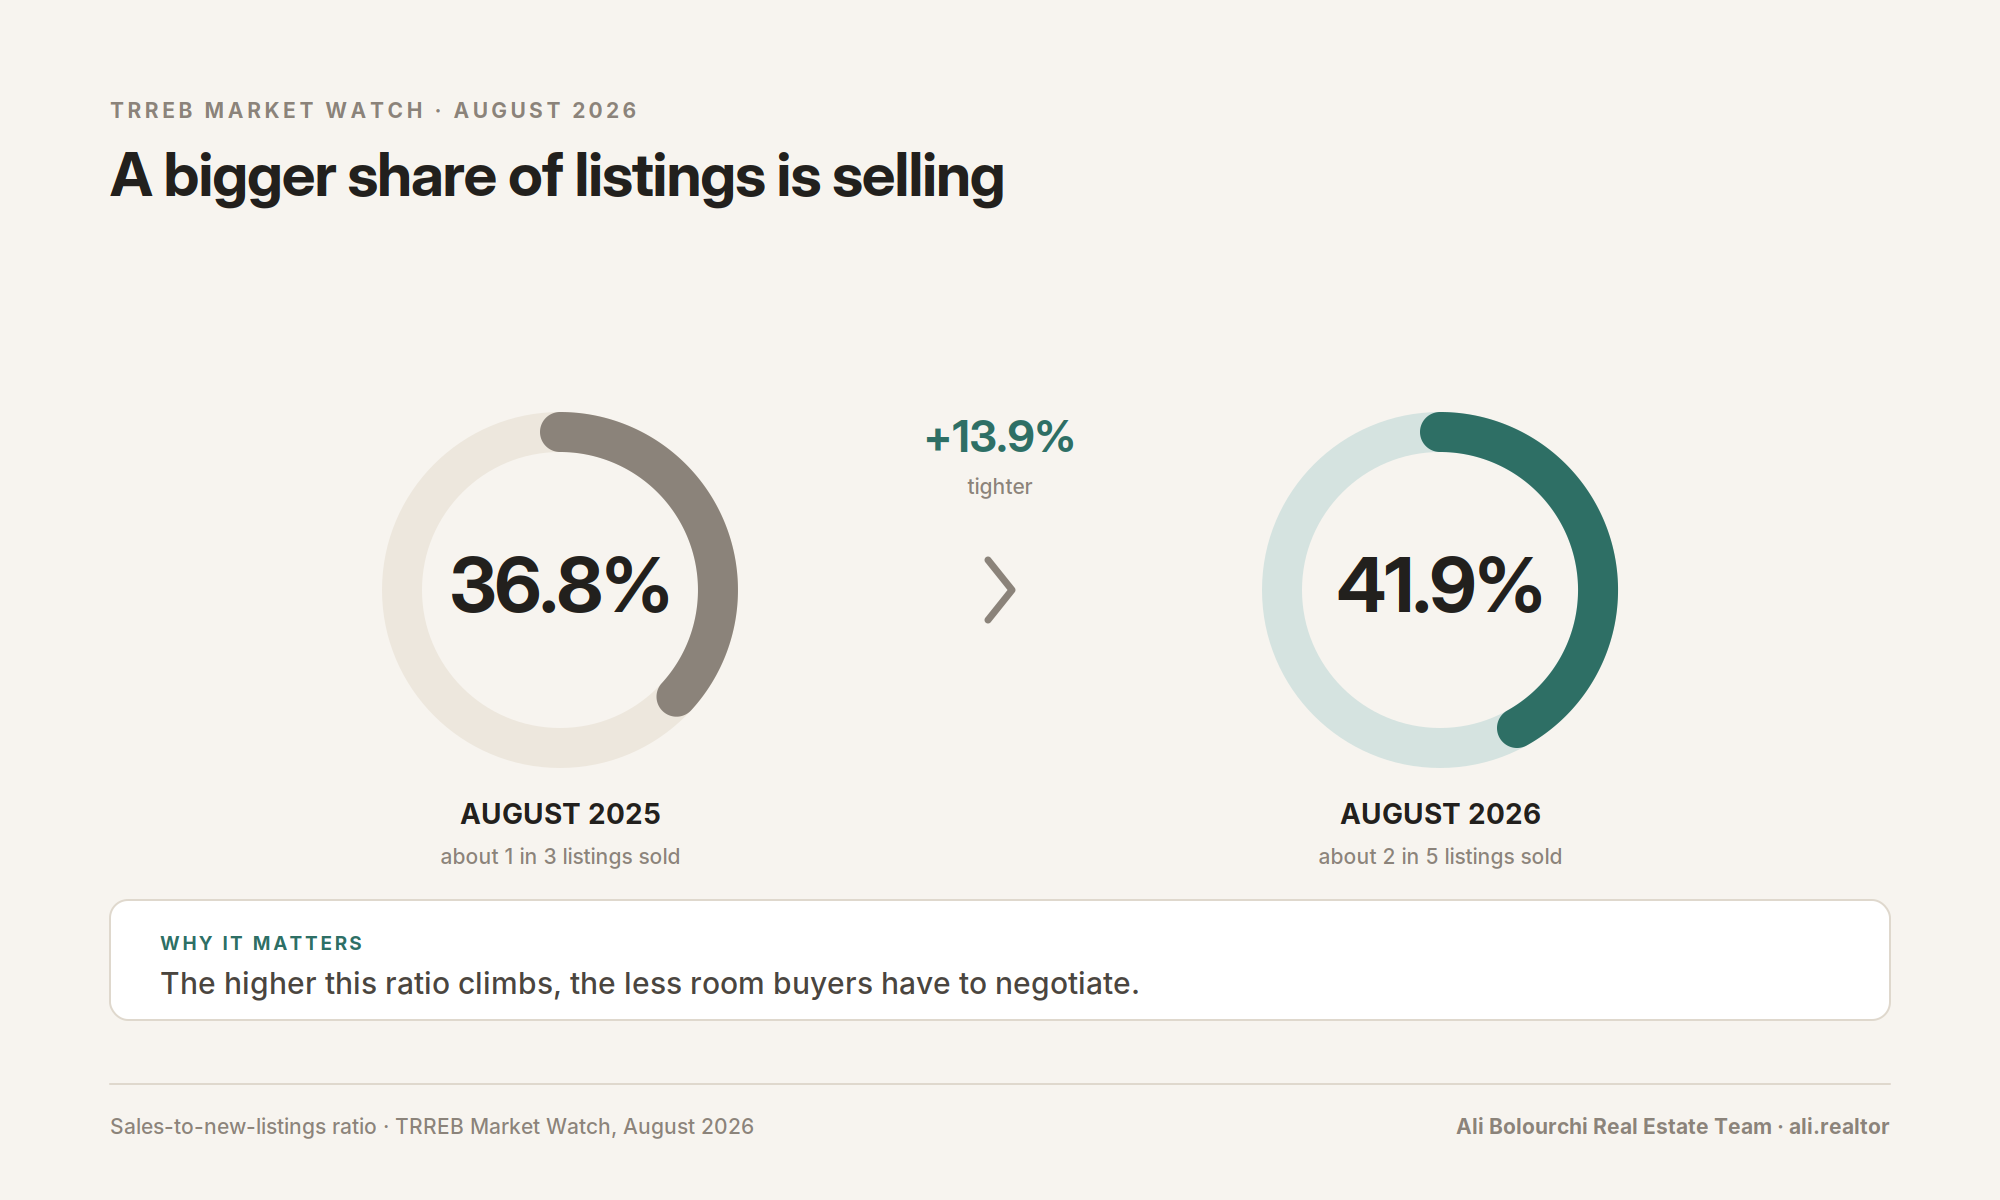
• Sales-to-new-listings ratio: 41.9%, up from 36.8% a year ago
• Months of inventory: 4.6
• Average listing days on market: 35, versus 33 in August 2025
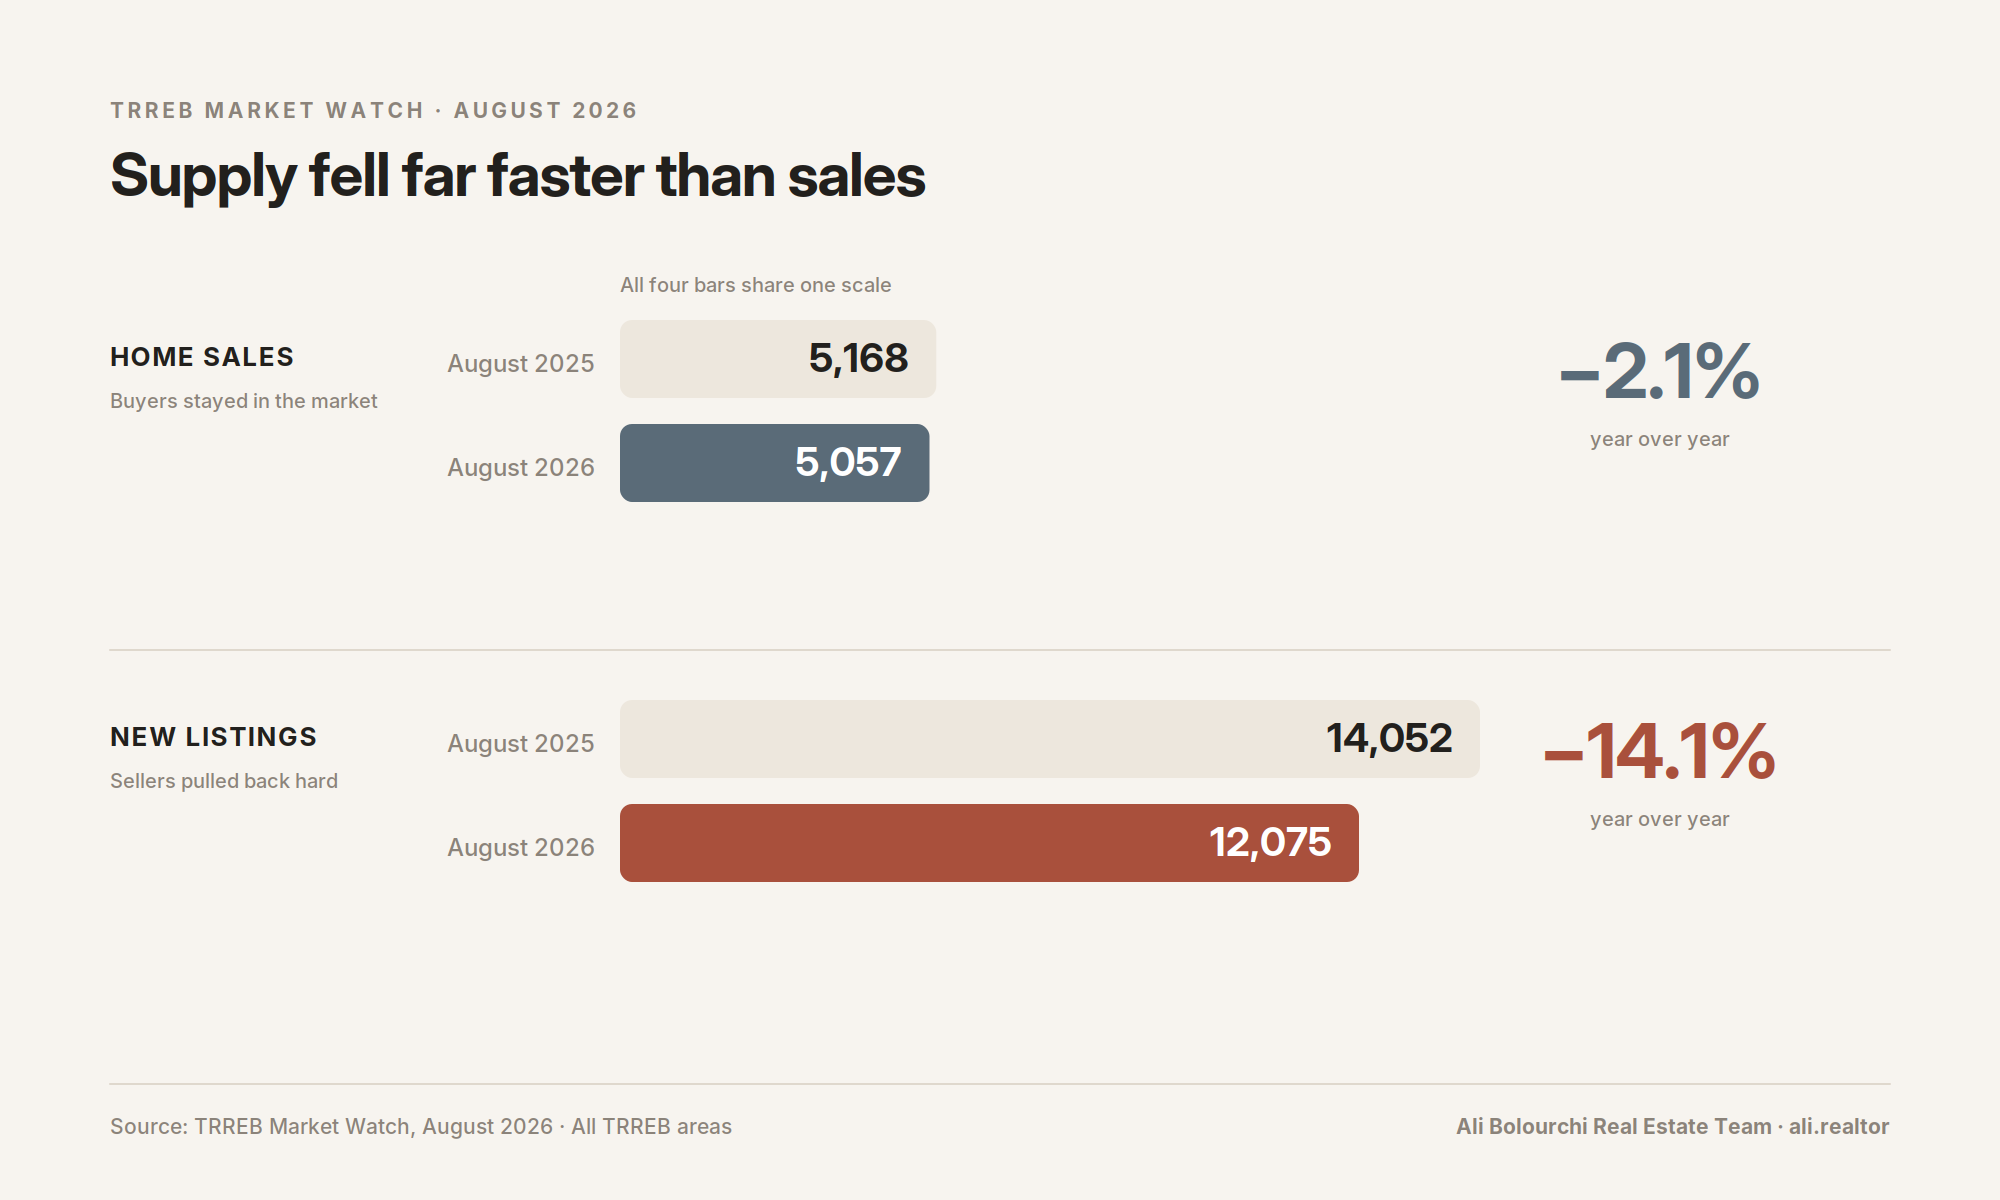
Two numbers deserve to be read together. The average price is down 2.7% from last August, but the pool of homes available to buy is down 11.3%. Falling prices with falling inventory is an unstable combination. It usually resolves in one direction, and TRREB is signalling which one it expects.
One caveat worth keeping in view: on a seasonally adjusted basis, the average selling price actually edged up over July, and the HPI Composite was essentially flat month over month. The sub-$1M headline is partly a seasonal artifact of August being a quiet month, not a fresh leg down.
Detached Homes: Sales Grew While the Market Shrank
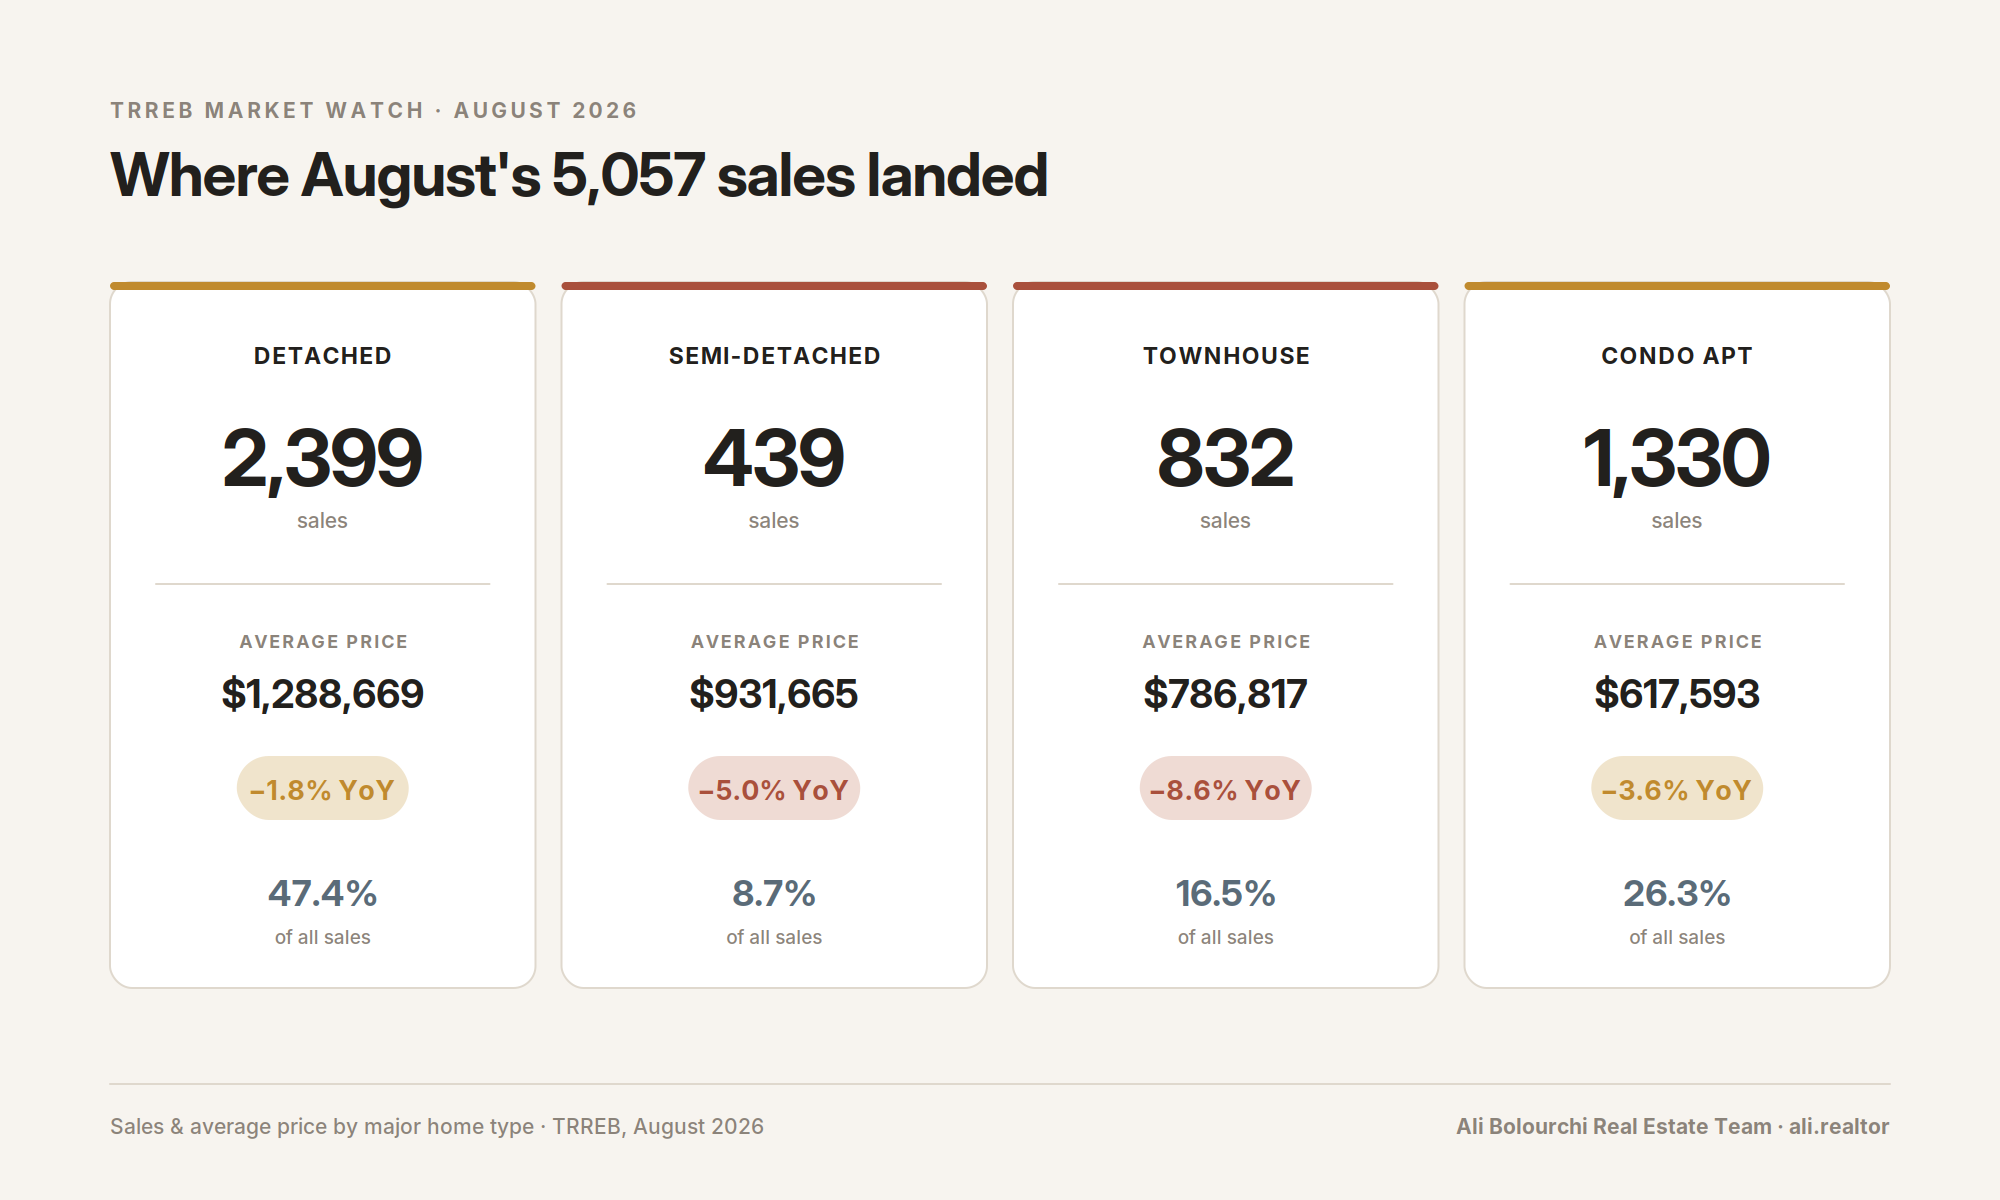
Detached homes accounted for 2,399 sales, 47.4% of all GTA transactions, at an average price of $1,288,669, down 1.8% year over year.
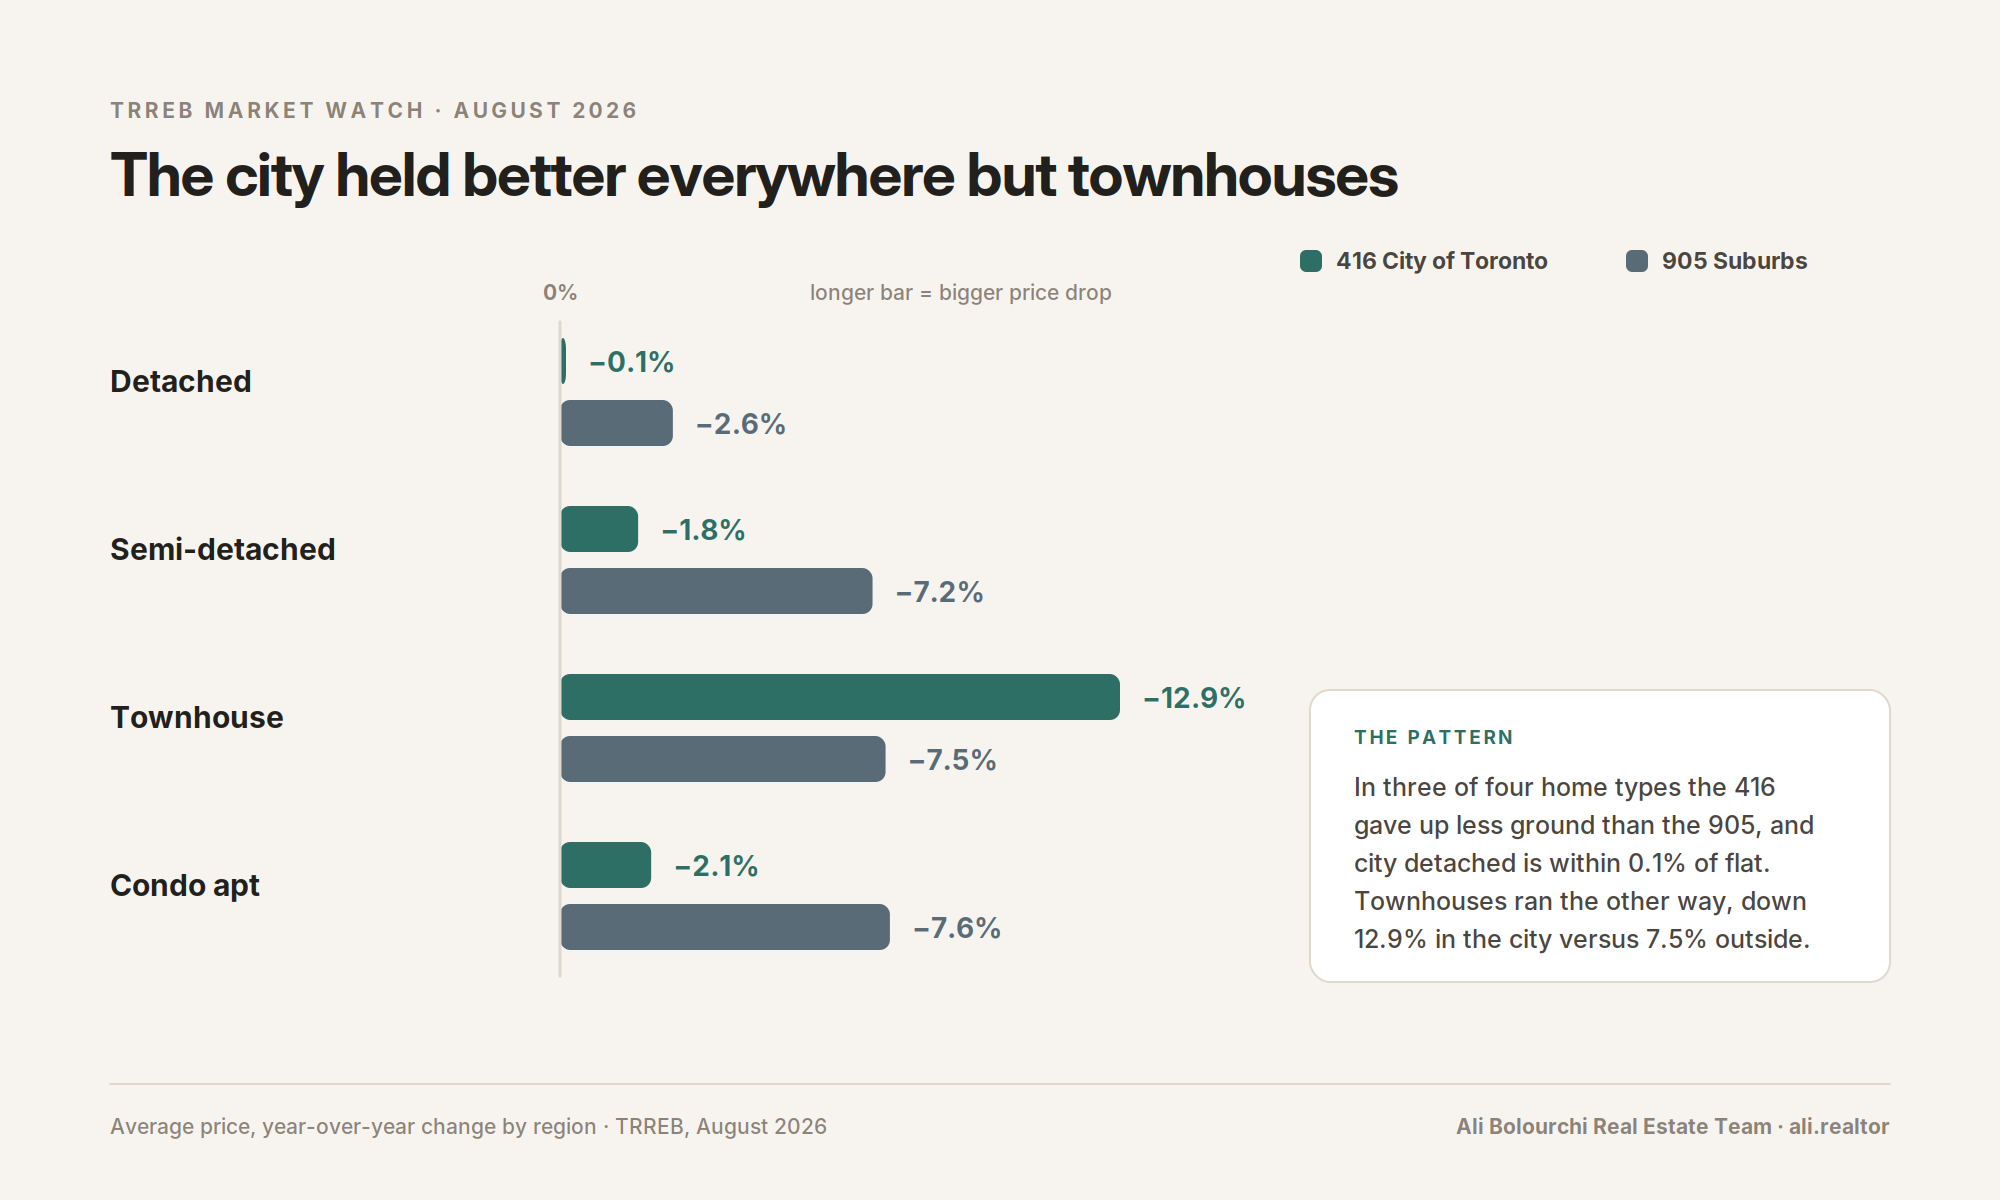
• City of Toronto (416): 550 sales, up 3.6%, average price $1,525,749, down just 0.1%
• Suburbs (905): 1,849 sales, down 0.4%, average price $1,218,148, down 2.6%
Insight: Detached was the only major segment where total sales rose while overall market volume fell. And at 0.1% below last August, the 416 detached average price is effectively flat. Of every segment in this report, city detached is the closest to having stopped falling.
Semi-Detached: A Sharp Snap Back in the City
Semi-detached homes recorded 439 sales, up 0.9%, at an average price of $931,665, down 5.0% year over year.
• 416: 159 sales, up 1.3%, average price $1,110,639, down 1.8%
• 905: 280 sales, up 0.7%, average price $830,033, down 7.2%
Insight: In July, Toronto semis were down 9.9% year over year and I flagged them as the month’s clearest opportunity. In August that gap closed to 1.8%. Be careful reading too much into one month, because 159 sales is a small enough sample that a handful of high-end trades moves the average. Still, the direction is real, and the discount that was sitting in city semis has largely been picked up.
Townhouses: August’s Clear Weak Spot
Townhouses posted 832 sales, down 9.5%, at an average price of $786,817, down 8.6% year over year. Both figures were the weakest of any major home type.
• 416: 165 sales, down 11.3%, average price $797,856, down 12.9%
• 905: 667 sales, down 9.0%, average price $784,086, down 7.5%
Insight: This is the reverse of July, when Toronto townhouse sales jumped 8.7%. Falling sales and falling prices together means genuine demand softness, not just a discount. For buyers, this is now the segment with the most negotiating room in the entire GTA. For anyone listing a townhouse this fall, price to the market you have, not the one you had last spring.
Condo Apartments: The City Floor Is Holding
Condo apartments recorded 1,330 sales, 26.3% of the market, at an average price of $617,593, down 3.6% year over year.
• 416: 885 sales, down just 0.2%, average price $651,648, down 2.1%
• 905: 445 sales, down 6.9%, average price $549,868, down 7.6%
Insight: Toronto condo sales were essentially unchanged from last August and the price decline stayed inside a narrow band, at 2.1% after 1.6% in July. Two months of low single-digit declines following a long stretch of much steeper ones is what a floor looks like while it forms. The 905 condo market is a different story entirely, down 7.6%, and the two should not be discussed as one asset.
The Economic Backdrop
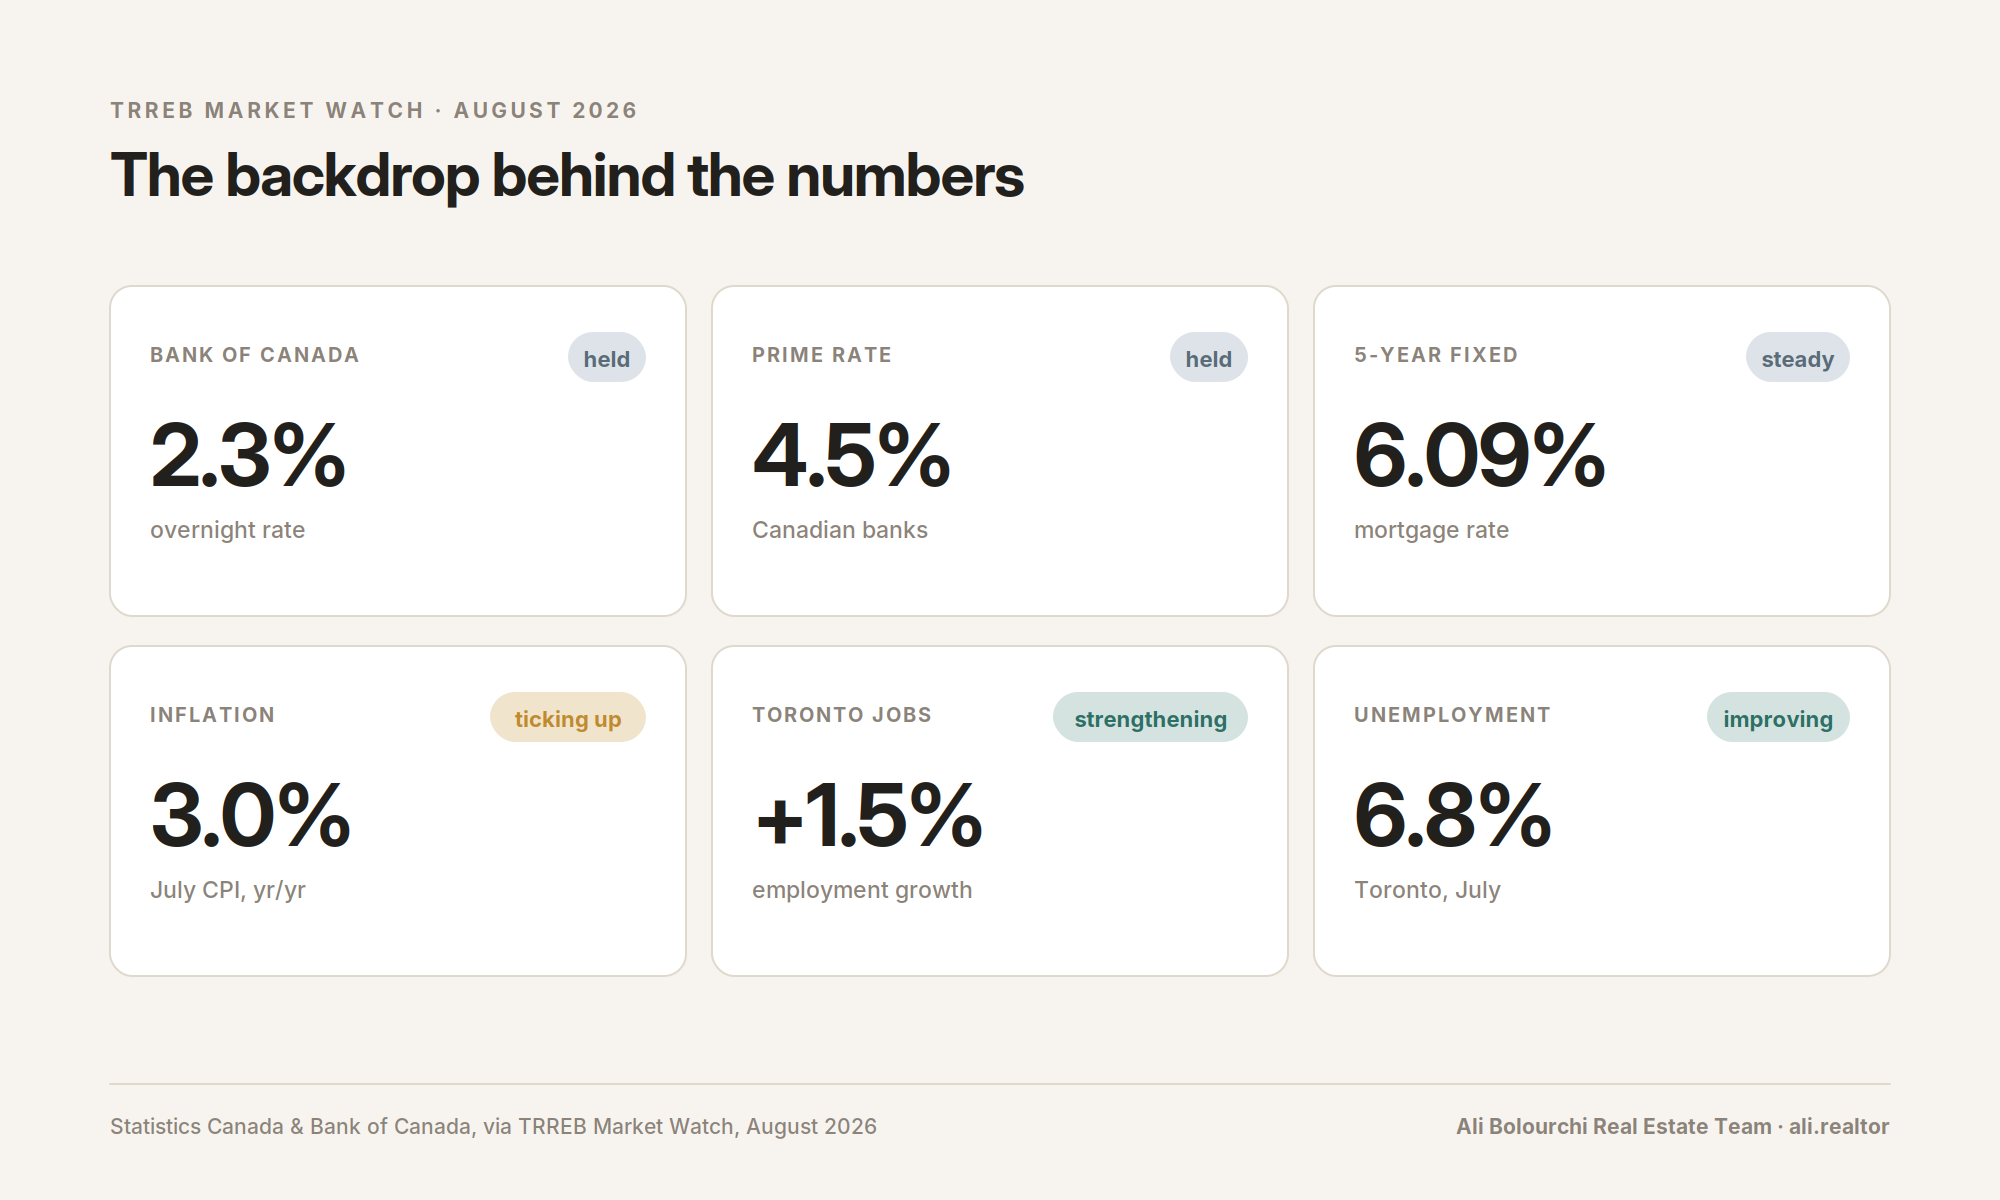
The labour market strengthened. Toronto employment grew 1.5% in July, up from 0.9% the month before, and the unemployment rate fell to 6.8% from 7.2%. Inflation moved the other way, ticking up to 3.0% from 2.8%. The Bank of Canada held its overnight rate at 2.3%, prime stayed at 4.5%, and mortgage rates were unchanged at 5.49% for one year, 6.05% for three, and 6.09% for five.
TRREB President Daniel Steinfeld framed the choice facing buyers directly: "If inventory tightens and home prices begin to rise, some buyers may face a trade-off between waiting for greater economic certainty and purchasing before prices move higher. At the same time, improving market conditions for sellers could bring more listings to market, providing buyers with additional choice."
Chief Information Officer Jason Mercer pointed at what is actually holding households back: "Ownership housing in the GTA has remained relatively affordable over the past year, with average prices dipping and mortgage rates remaining somewhat flat. Recent news on the overall economy and job creation has been positive. The main hold-back for many households has been concerns around trade with the United States and the potential for higher inflation and borrowing costs in the future."
CEO John DiMichele used the moment to press on supply policy: "A more balanced resale market is a positive development, but it does not address Ontario’s ongoing housing supply and affordability challenges. Governments should take advantage of this opportunity to eliminate barriers to attainable housing, including restrictive zoning policies, high taxes and development charges, and lengthy approval processes."
What This Means for You
If You’re Buying
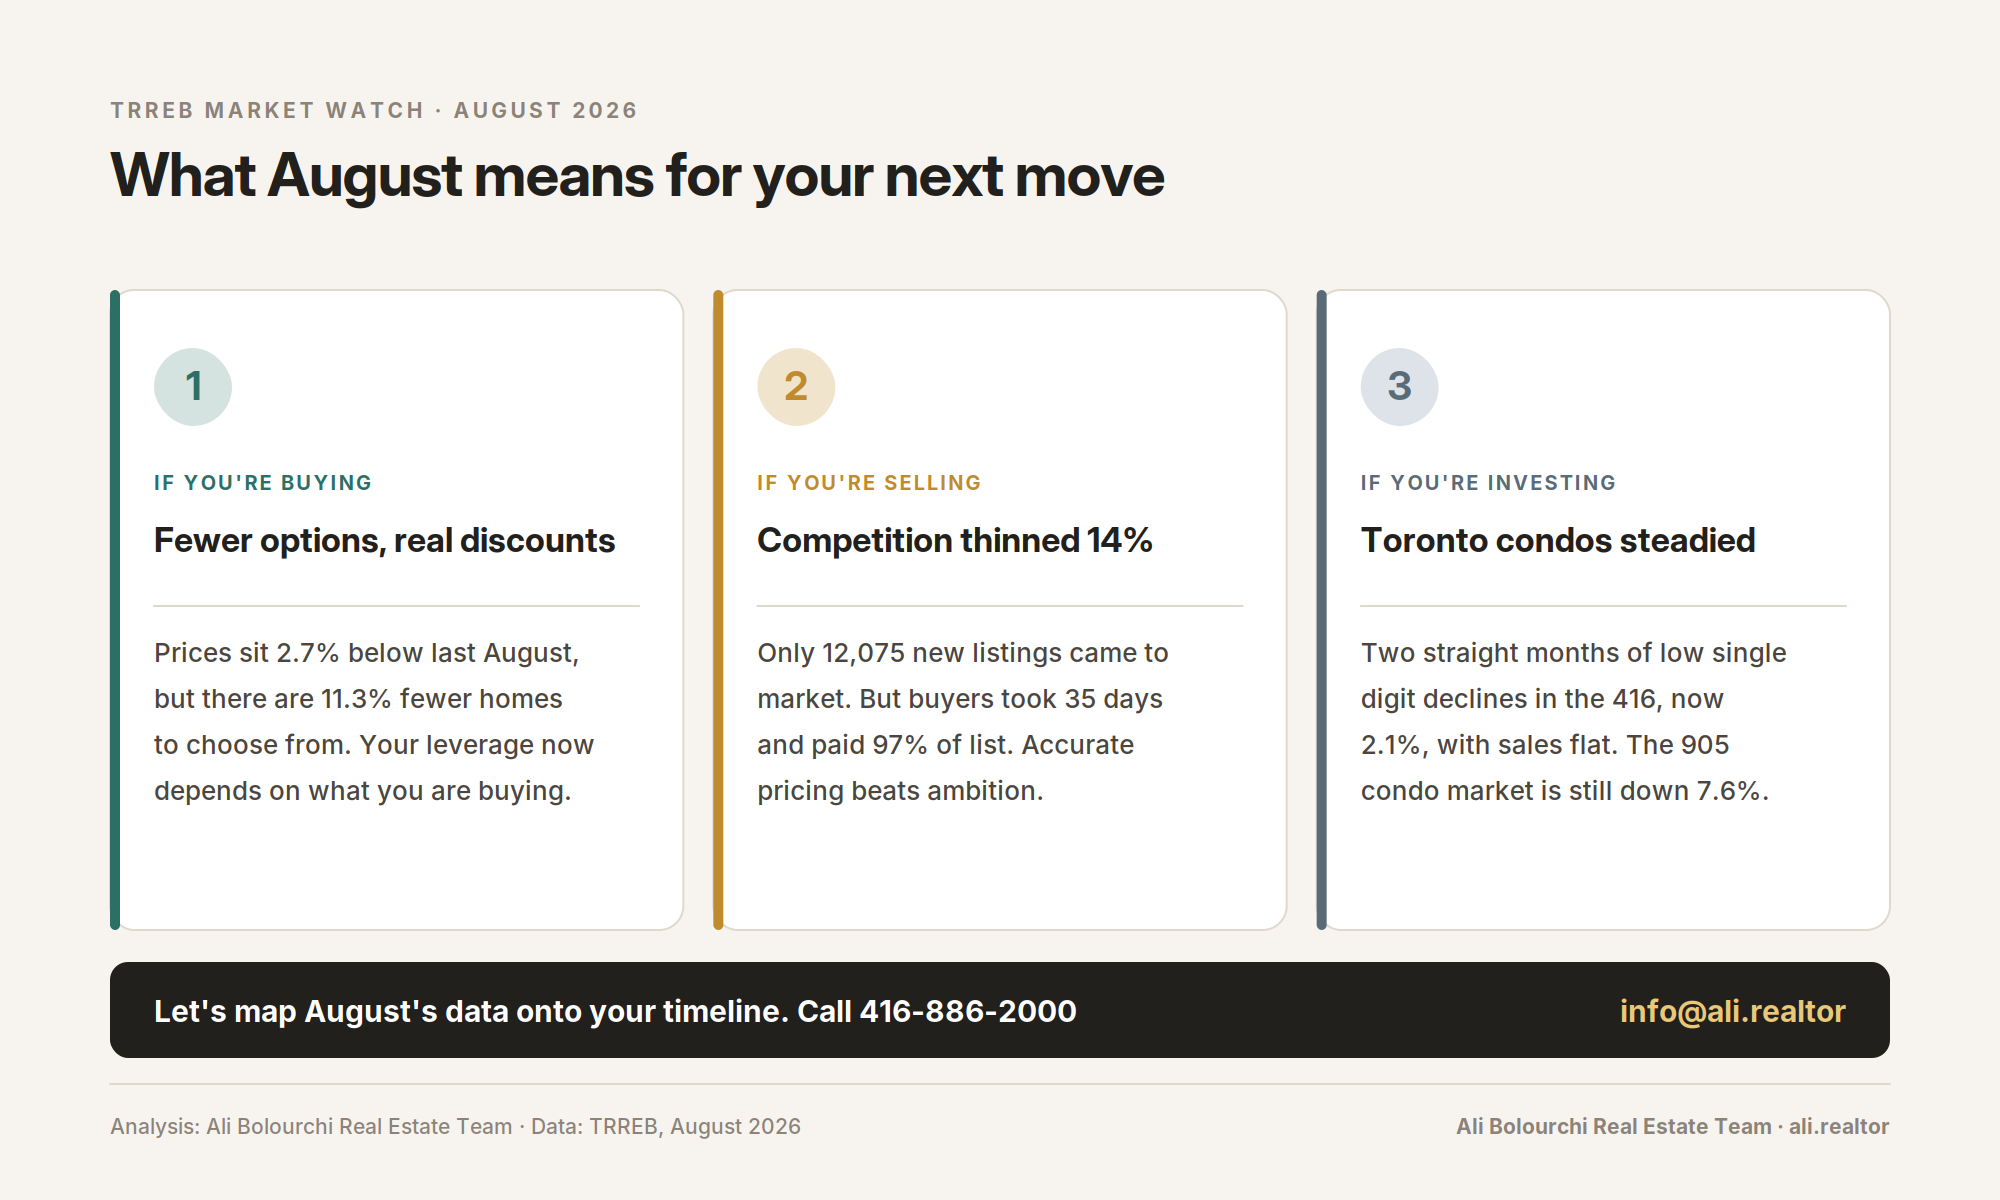
You are getting a genuinely lower average price than last year, and that is real. What you are also getting is 11.3% fewer homes to choose from, which is why sales fell even though buyers were active. The practical consequence is that your leverage now depends heavily on what you are buying. Townhouses give you room. City detached and city condos give you very little. Decide which trade-off you are actually making before you write an offer.
If You’re Selling
Your competition thinned again, with 14.1% fewer new listings than last August. But buyers took 35 days to commit versus 33 a year ago, and homes are selling at 97% of list. That combination rewards accurate pricing and punishes ambition. If you have been waiting for a better moment to list, Steinfeld’s own comment is worth reading twice: improving conditions for sellers are likely to bring more listings to market, and the sellers who move first face the least competition.
If You’re Investing
The 416 condo market has now posted two consecutive months of low single-digit price declines alongside flat sales volume, at an average of $651,648. That is the stabilization pattern this segment has not shown since the correction began. The 905 condo market, down 7.6%, has not reached the same point. If you are buying condos on a three to five year horizon, geography matters more this cycle than it has in years.
Which side of August’s numbers are you on?
Whether inventory scarcity is a problem or an opportunity depends entirely on what you own and what you want next. Let’s look at your neighbourhood, your property type, and your timeline together.
Ali Bolourchi Real Estate Team
416-886-2000 | [email protected]
Ali.Realtor | GTALuxuryHomes.ca | The4Sale.com
Source: Toronto Regional Real Estate Board (TRREB) Market Watch, August 2026. Statistics reflect all TRREB areas. This article is for information purposes only and is not intended to solicit buyers or sellers currently under contract with a brokerage.

Comments:
Post Your Comment: