


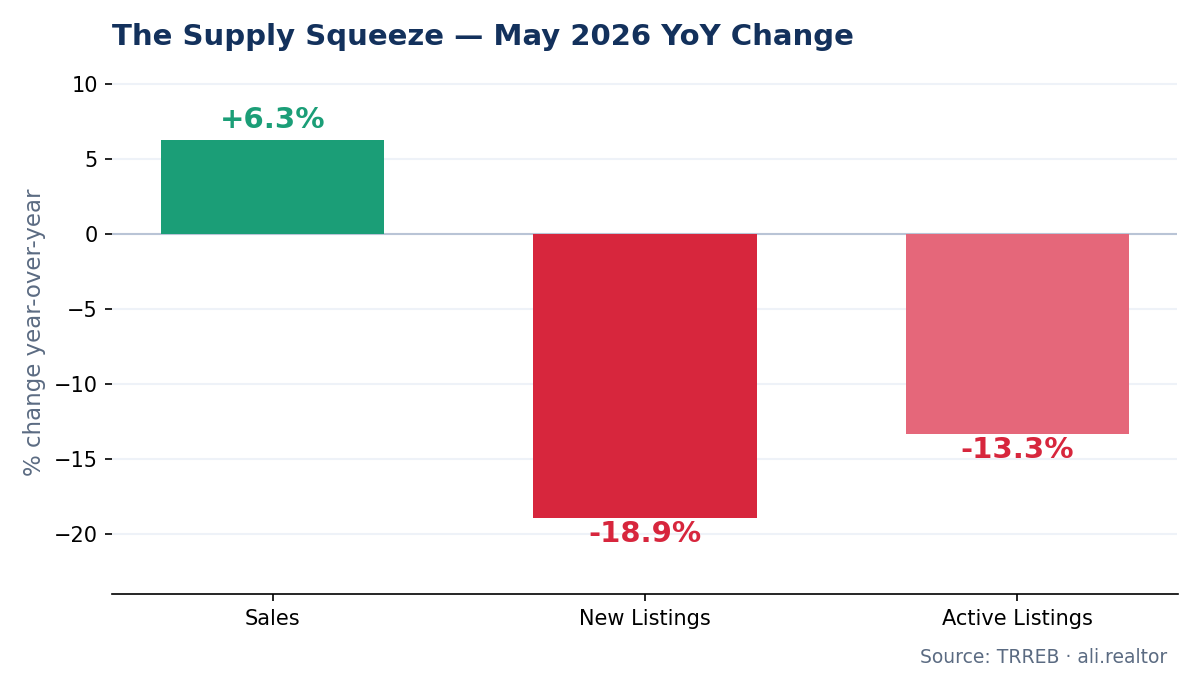
According to the latest TRREB Market Watch, the Greater Toronto Area resale market tightened sharply in May 2026: sales rose 6.3% year-over-year to 6,583, while new listings collapsed 18.9% to 17,698 — double April's rate of decline. On a seasonally adjusted basis, sales jumped 10% month-over-month and the average selling price ticked up versus April.

When sales grow and listings fall this fast, standing inventory gets absorbed, buyer competition intensifies neighbourhood by neighbourhood, and the price slide stops. Through the first five months of 2026, the GTA has recorded 24,405 total sales at a year-to-date average price of $1,032,238.
Here are the four numbers that define the month:
Sales: 6,583 (up 6.3% YoY)
New Listings: 17,698 (down 18.9% YoY)
Average Price: $1,069,700 (down 4.6% YoY)
Sale-to-List Ratio: 98%, with homes selling in an average of 27 days
"If sales strengthen further relative to listings, selling prices will level off and even start to grow as we move into 2027." — TRREB Chief Information Officer Jason Mercer
🏡 Detached Homes
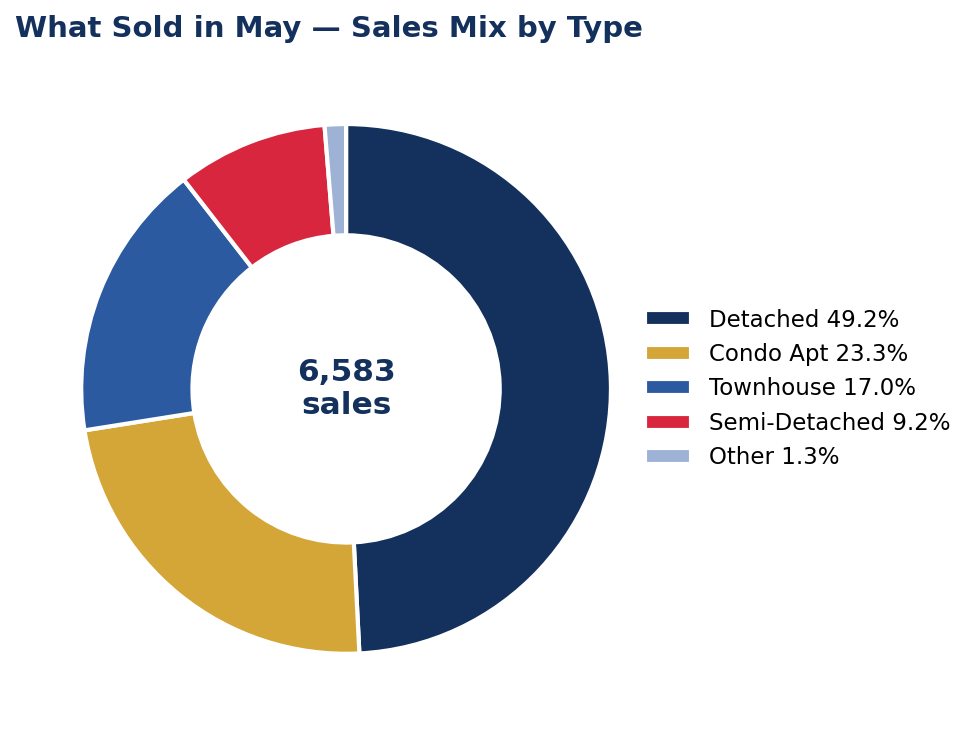
Detached homes led the market again, posting 3,236 sales (49.2% of all GTA transactions) and a 9.0% year-over-year sales gain — the broadest demand recovery of any property type, while prices remain below 2025 levels.
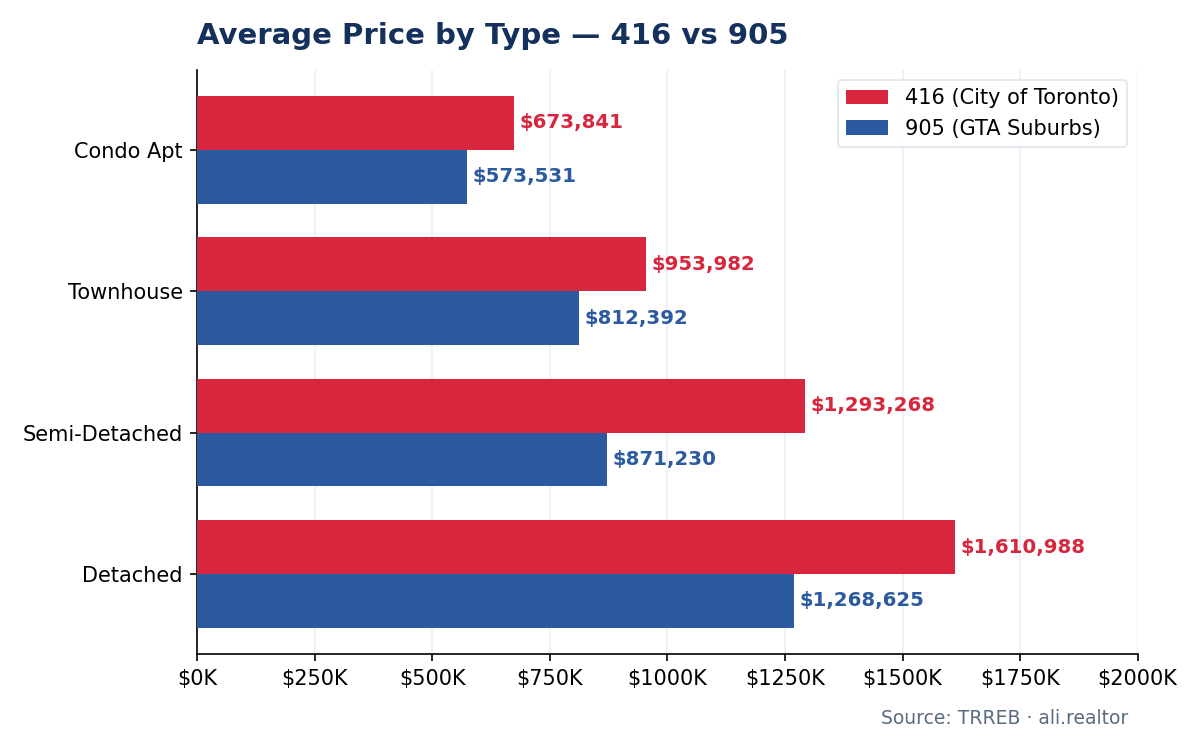
416 (City of Toronto): 846 sales, up 8.9% YoY · Average price $1,610,988, down 6.5% YoY
905 (GTA Suburbs): 2,390 sales, up 9.0% YoY · Average price $1,268,625, down 3.9% YoY
The take: A 905 price decline of just 3.9% paired with 9% sales growth means suburban detached has found its floor — and buyers are competing for it. For sellers who held off through 2025, listing into a market with 18.9% fewer competing listings is the strongest case in the cycle.
🏘️ Semi-Detached Homes
The "missing middle" produced 608 sales. The standout is the 416, where prices held essentially flat — the most price-stable segment in the entire GTA.
416 (City of Toronto): 283 sales, up 2.5% YoY · Average price $1,293,268, down just 0.6% YoY
905 (GTA Suburbs): 325 sales, down 3.6% YoY · Average price $871,230, down 6.7% YoY
The take: A 416 semi holding within 0.6% of last year while the broader market is down 4.6% is the scarcity premium reasserting itself — the city simply cannot build more of them. For move-up buyers who want city freehold without the detached price tag, act here first.

🏙️ Townhouses
Townhouses recorded 1,114 sales (17% of the market), split between attached/row (663 sales, avg $916,474) and condo townhouses (451 sales, avg $729,081)
416 (City of Toronto): 222 sales, down 17.5% YoY · Average price $953,982, down 5.5% YoY
905 (GTA Suburbs): 892 sales, up 12.3% YoY · Average price $812,392, down 6.6% YoY
The take: The 416 sales pullback is a supply problem, not a demand one — well-located city townhouses are scarce. The 905 is the volume engine, with 12.3% sales growth at accessible price points. Own a Toronto townhouse in Leslieville, The Junction, or Riverdale? You're listing into a starved market
🏢 Condo Apartments
Condos posted 1,535 sales, up 4.2% YoY and 23.3% of all transactions — the most accessible entry point into GTA ownership at an average of $639,468.
416 (City of Toronto): 1,009 sales, up 4.2% YoY · Average price $673,841, down 5.0% YoY
905 (GTA Suburbs): 526 sales, up 4.2% YoY · Average price $573,531, down 9.5% YoY
The take: The 905 condo segment — a 9.5% YoY price drop with rising sales — is textbook bottom-formation. With the Bank of Canada at 2.3% and new-listing supply collapsing, this is the alignment professional investors wait for. If you're positioning a condo for a 3-to-5-year horizon, the entry window is closing in real time.
🔥 GTA Hotspots: Where the Market Is Moving
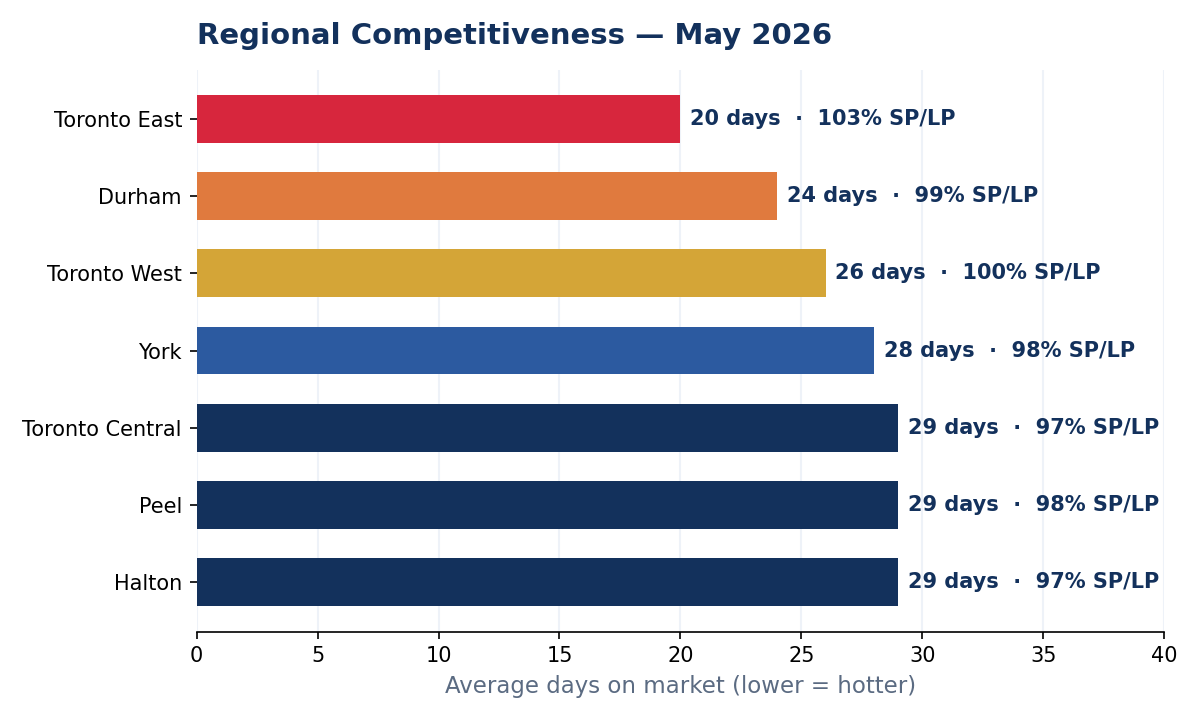
May sharpened the regional divergence. Toronto East is the fastest, most competitive submarket in the region — sellers there are routinely getting over asking.
Toronto East: 570 sales · 103% sale-to-list · 20 days on market (hottest in the GTA)
Durham Region: 804 sales · 99% sale-to-list · 24 days
Toronto West: 623 sales · 100% sale-to-list · 26 days
York Region: 1,183 sales · 98% sale-to-list · 28 days
Toronto Central: 1,184 sales · 97% sale-to-list · 29 days
Peel Region: 1,106 sales · 98% sale-to-list · 29 days
Halton Region: 816 sales · 97% sale-to-list · 29 days
📊 Economic Backdrop
The macro picture continues to support the shift: Bank of Canada overnight rate at 2.3%, prime at 4.5%, five-year fixed mortgages at 6.09%, and inflation at 2.4% — within target. The labour market stays soft, which is exactly why some would-be sellers remain on the sidelines and listings keep lagging sales.
"Spring sales have been stronger than last year, reflecting improved affordability from lower selling prices and borrowing costs. Sales are forecast to improve further as we move through the second half of this year." — Daniel Steinfeld, TRREB President
🎯 What This Means for You
If you're buying: The window of maximum opportunity is closing faster than a month ago. Prices are still below 2025, the BoC is at 2.3%, and supply is genuinely squeezed. TRREB is now forecasting price growth into 2027. The cost of waiting another quarter is now measurable.
If you're selling: You're in the strongest position since 2022. New listings are down 18.9% YoY, so well-priced, well-presented homes face dramatically less competition. The 98% sale-to-list ratio and 27-day average are all working in your favour. The spring window is wide open.
If you're investing: 905 condos — 4.2% sales growth at 9.5% lower pricing — are textbook bottom-formation. Rates are accommodative, supply is structurally constrained, and rental demand is robust. For a 3-to-5-year horizon, this is the entry environment investors wait years for.
Ready to Act on This Market?
The May 2026 data is unambiguous — the market has turned and the supply squeeze is accelerating it. Whether you're buying your first home, executing a strategic move-up, listing a property you've held for years, or building a portfolio, let's talk about exactly what this means for your timeline and your numbers.
📞 Call 416-886-2000 · ✉️ [email protected] · 🌐 Visit ali.realtor
Data sourced from TRREB Market Watch, May 2026 (released June 3, 2026). All figures represent Greater Toronto Area MLS® System activity.