


Toronto midtown · July 2026 market data · Ali Bolourchi
Two of Toronto's most established addresses, eight kilometres apart, behaving like two different markets. Forest Hill costs more and moves slower. Lawrence Park costs less and clears faster. If you are buying one of them as an investment, that difference matters more than the price gap.
The short answer
On the year to date numbers, Lawrence Park is the stronger investment case for most buyers, and it wins on liquidity rather than on price growth. Homes there sell in a median of 11 days at 98.1% of asking, and one sale in four goes above list. Forest Hill sells in a median of 17 days at 95.8% of asking, with one in seven above list. Forest Hill is the better market to negotiate in. Lawrence Park is the better market to get out of.
Lawrence Park North & South (Toronto C04)Forest Hill North & South (Toronto C03, C04)

Source: MLS market report, all property types, year to date through July 2026, same period and same source for both areas. Sale prices, not list prices.
Why liquidity is the whole argument
Both neighbourhoods will hold their value. Neither is going out of style. The measurable difference is how reliably you can turn one back into cash, and on every liquidity measure Lawrence Park is ahead.
WHAT HAPPENS TO 100 LISTINGS
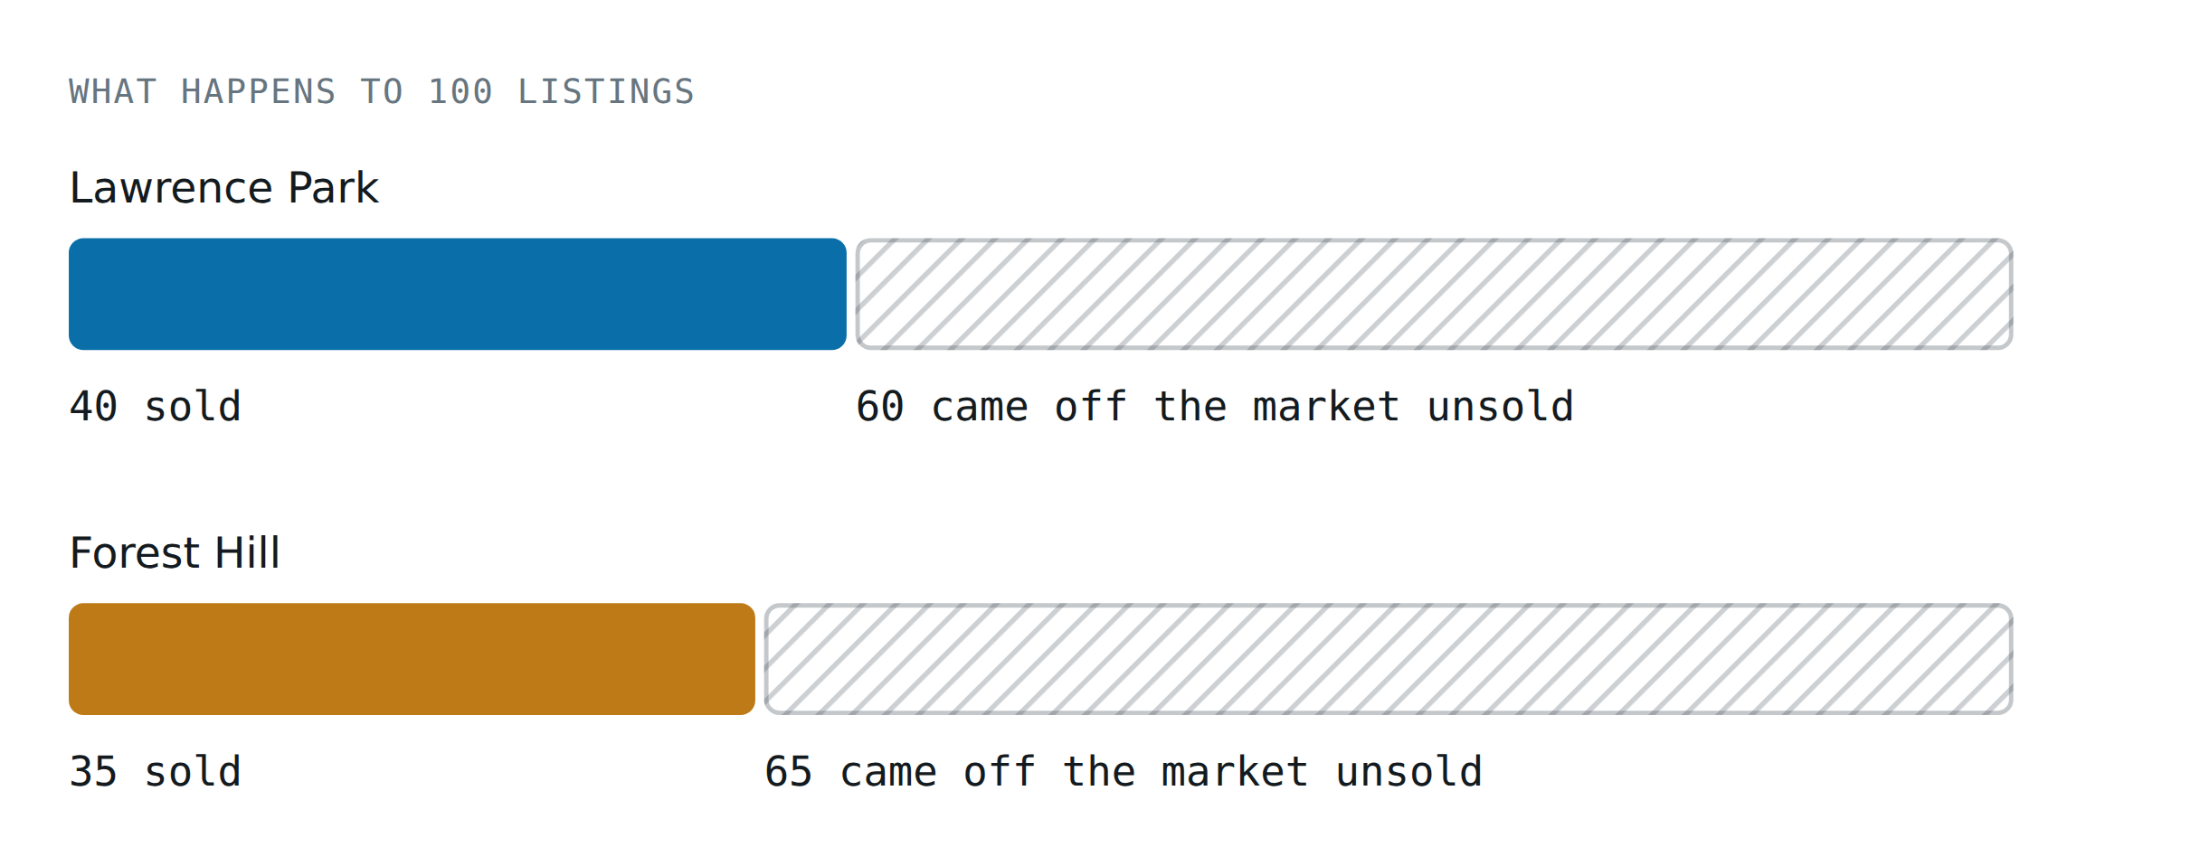
Solid is sold, hatched is withdrawn or expired. Averaged across every monthly listing cohort from March 2025 to February 2026. Cohorts after that are excluded because those listings have not had time to resolve. Calculated independently, year to date sales as a share of new listings land in the same place: 40.6% and 33.2%.
That is the number most people have never seen, and it is the one I would want if I were buying. In both neighbourhoods, most listings never sell. The year to date terminations confirm it: Lawrence Park recorded 197 terminations against 189 sales, Forest Hill 112 against 91. In Forest Hill, for roughly every four homes that sold, five came off the market unsold.
MEDIAN TIME TO SELL, YEAR TO DATE
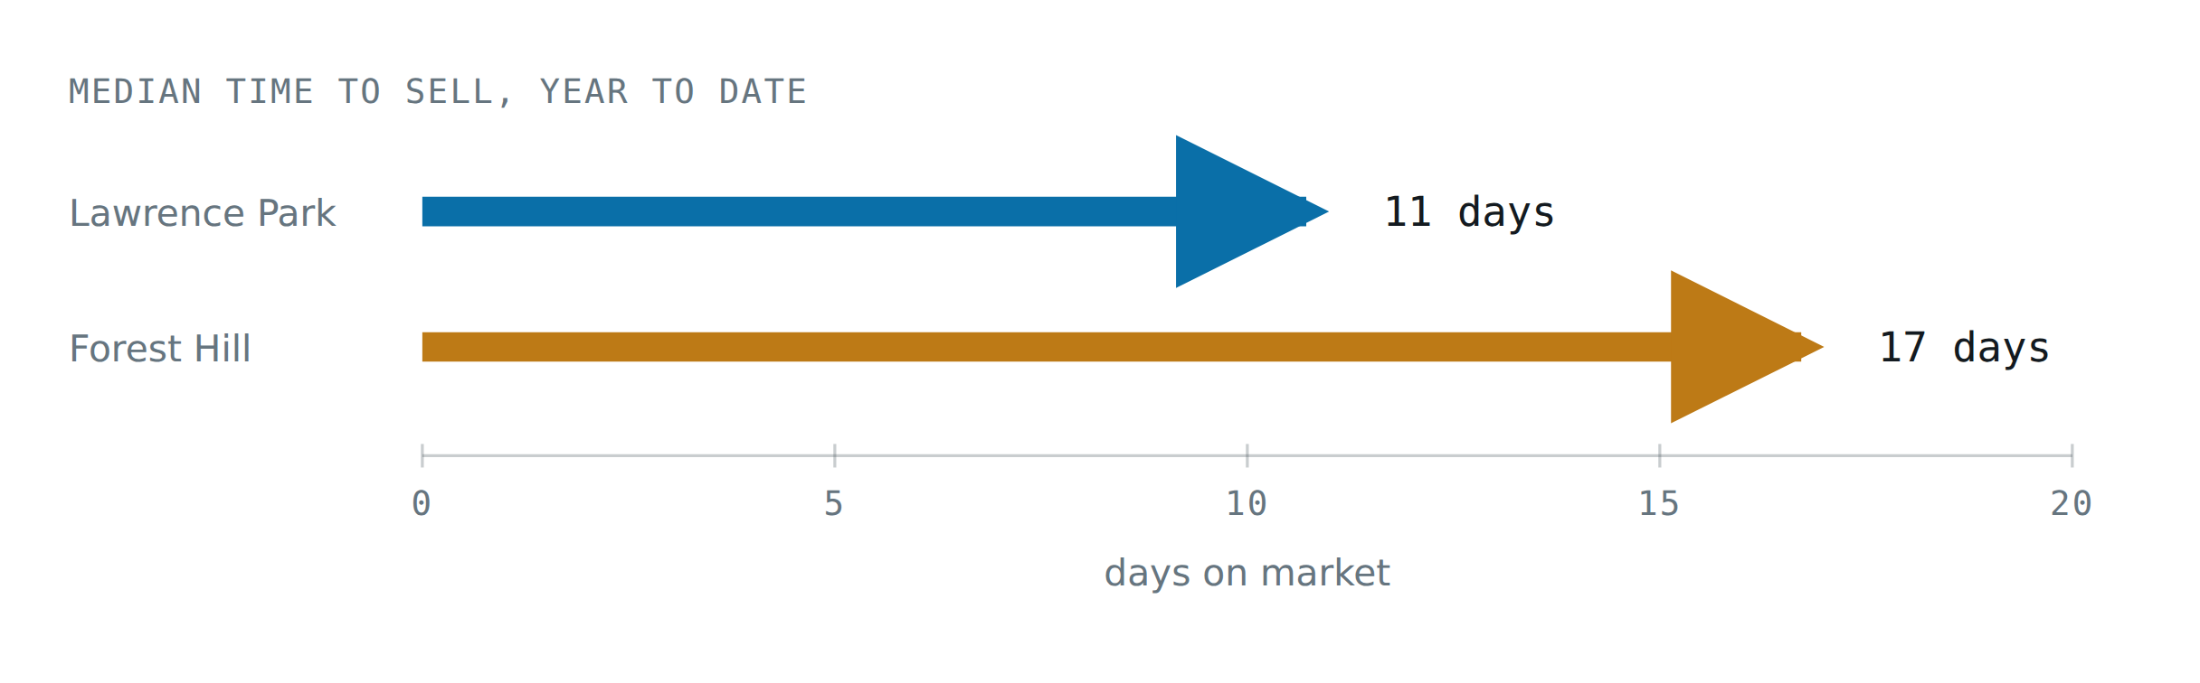
Six days of difference at the median, and the gap widens at the average: 23 days against 30. Lawrence Park also holds more of its asking price, 98.1% against 95.8%, and sells above list in a quarter of cases against one in seven.
One number in this data will mislead you
Forest Hill's average list price year to date is $4,358,446. Its average sale price is $2,631,413. That looks like sellers are accepting 40% below asking. They are not. Those two figures are averages of two different groups of houses.
WHY THE TWO AVERAGES DO NOT COMPARE
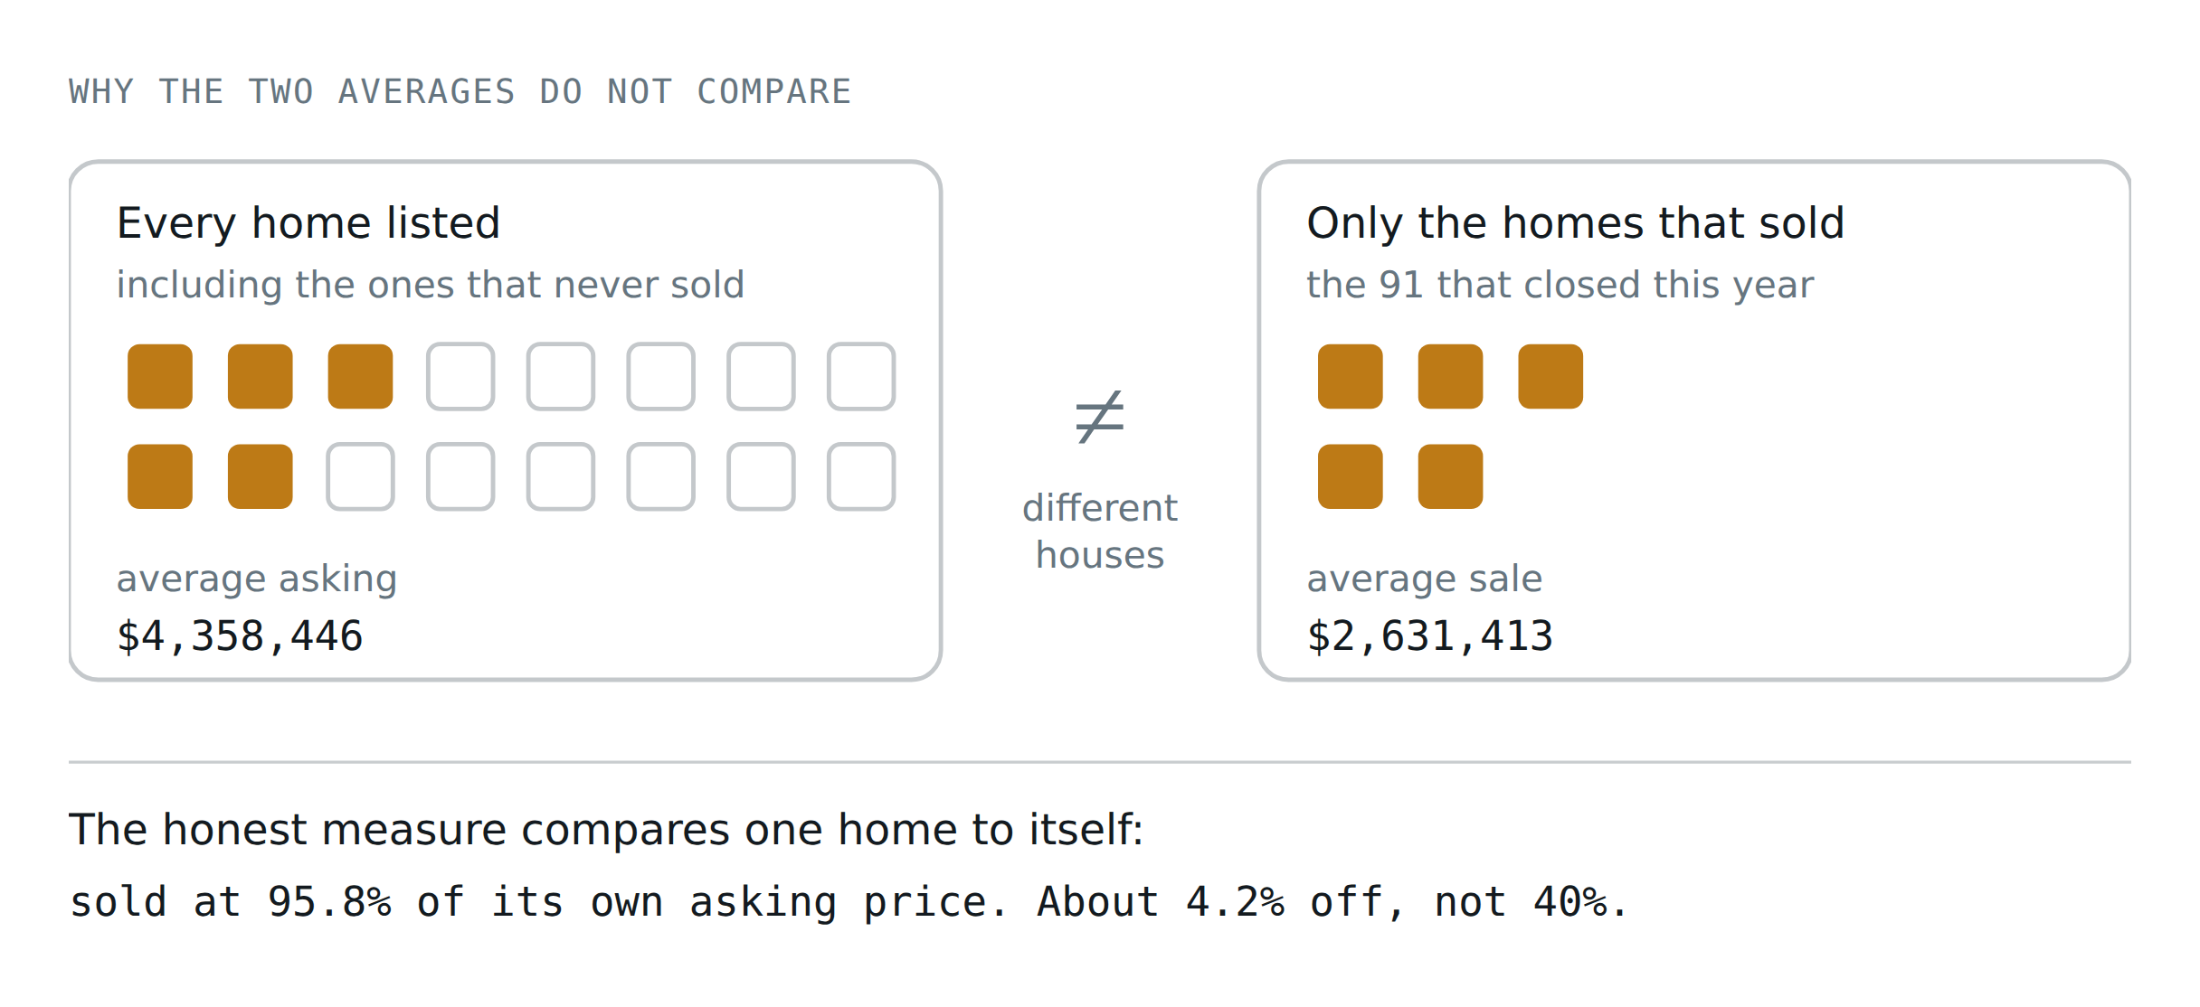
The honest measure compares one home to itself:sold at 95.8% of its own asking price. About 4.2% off, not 40%.
The list price average is dragged upward by expensive listings that never found a buyer. The sale price average only ever contains homes that did. What the wide gap really tells you is that Forest Hill's priciest listings are sitting, which is useful, but it is a different fact from how hard sellers are negotiating.
The full comparison
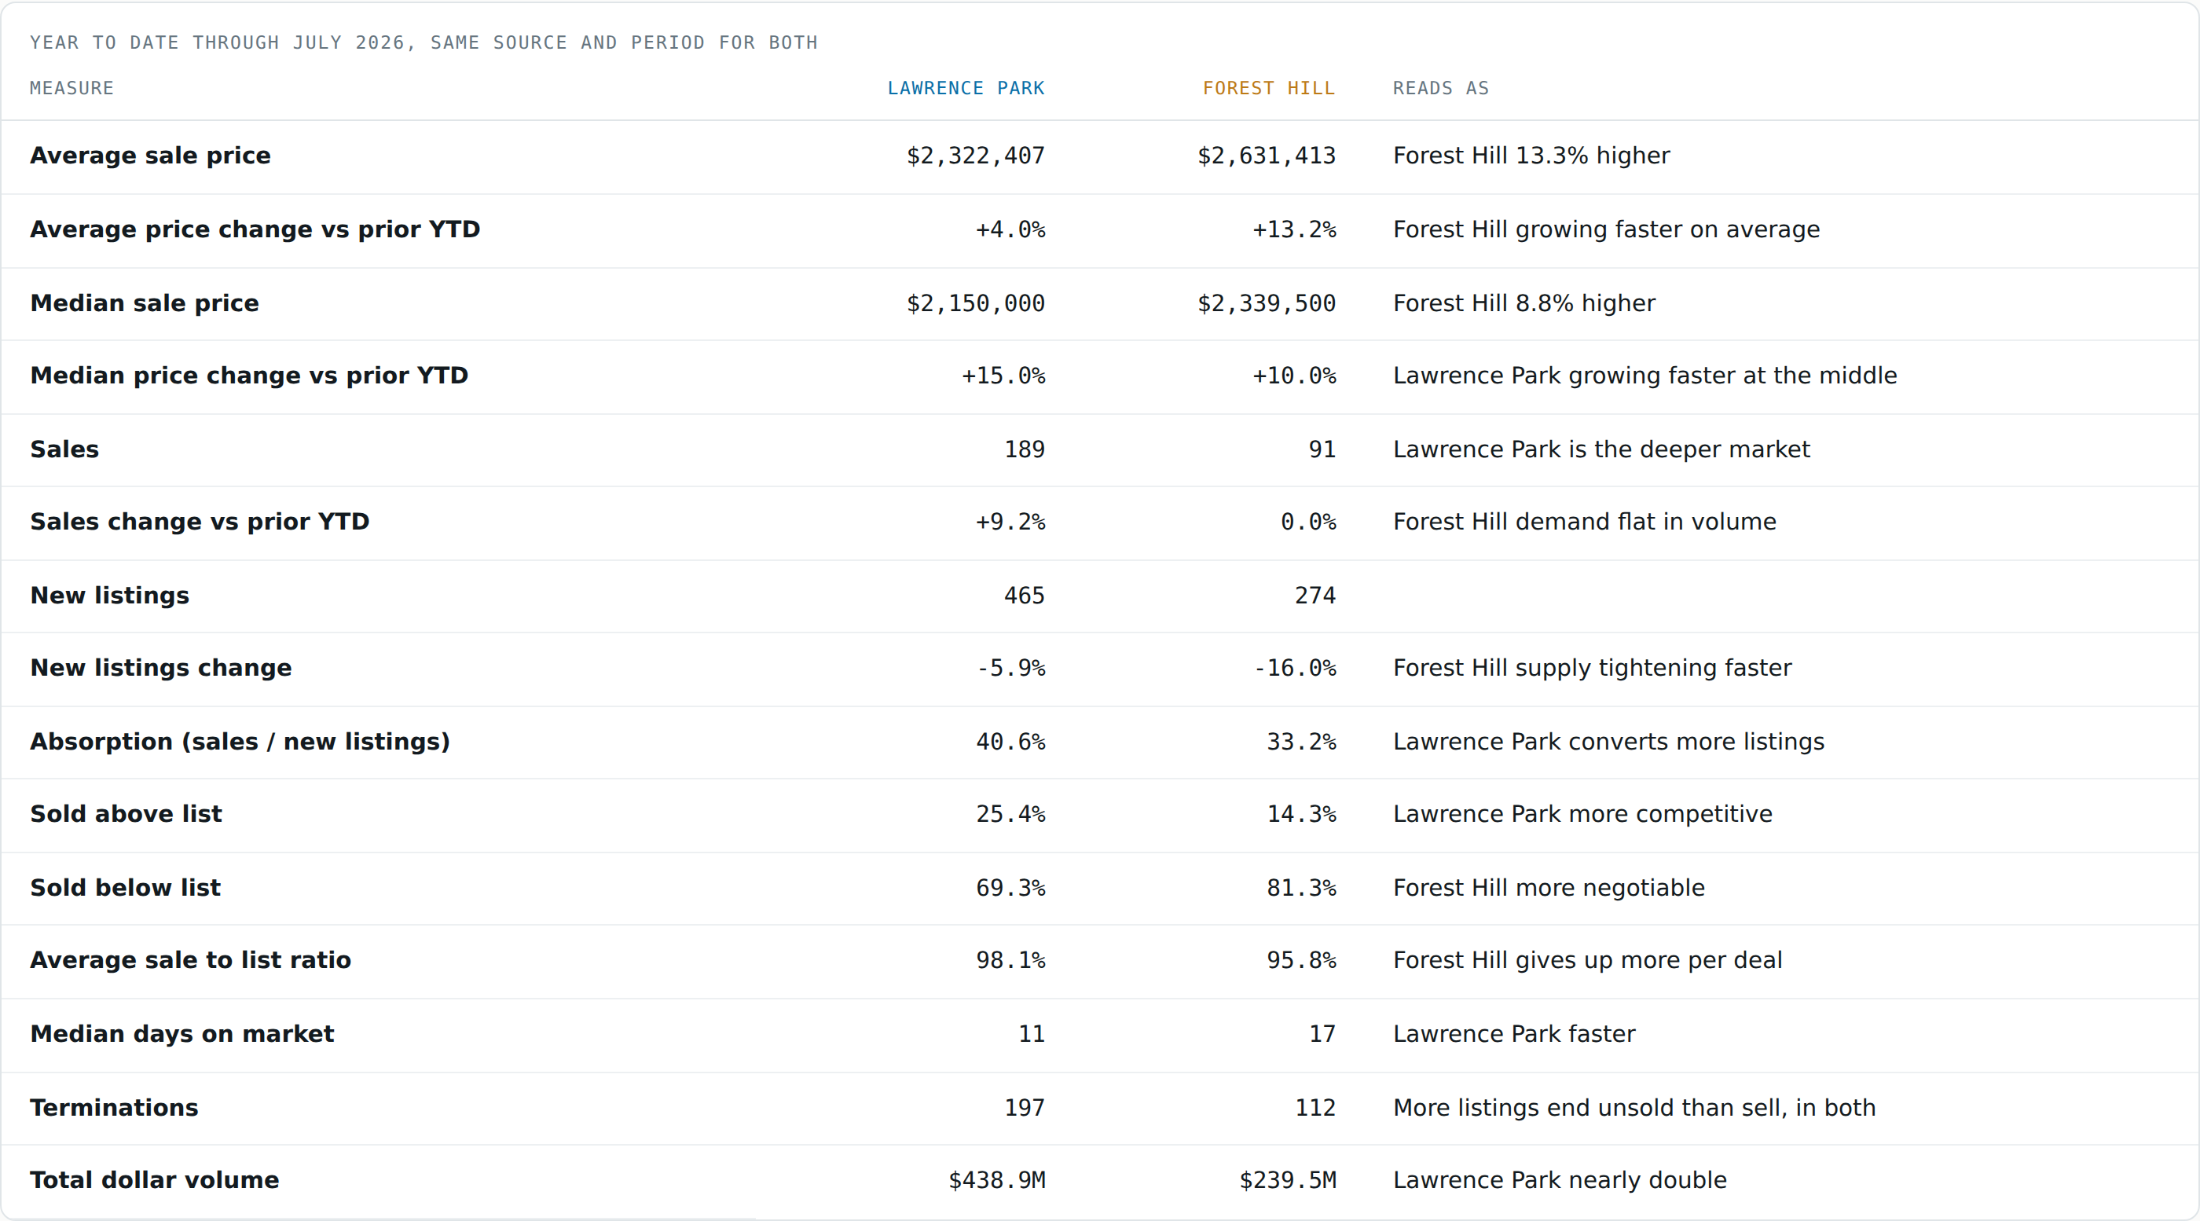
All figures MLS market report, year to date through July 2026, all property types, all architectural styles, all bed and bath counts. Lawrence Park North and South (Toronto C04). Forest Hill North and South (Toronto C03 and C04). Absorption and dollar volume rounding calculated from the same report.
What the July figures are not telling you
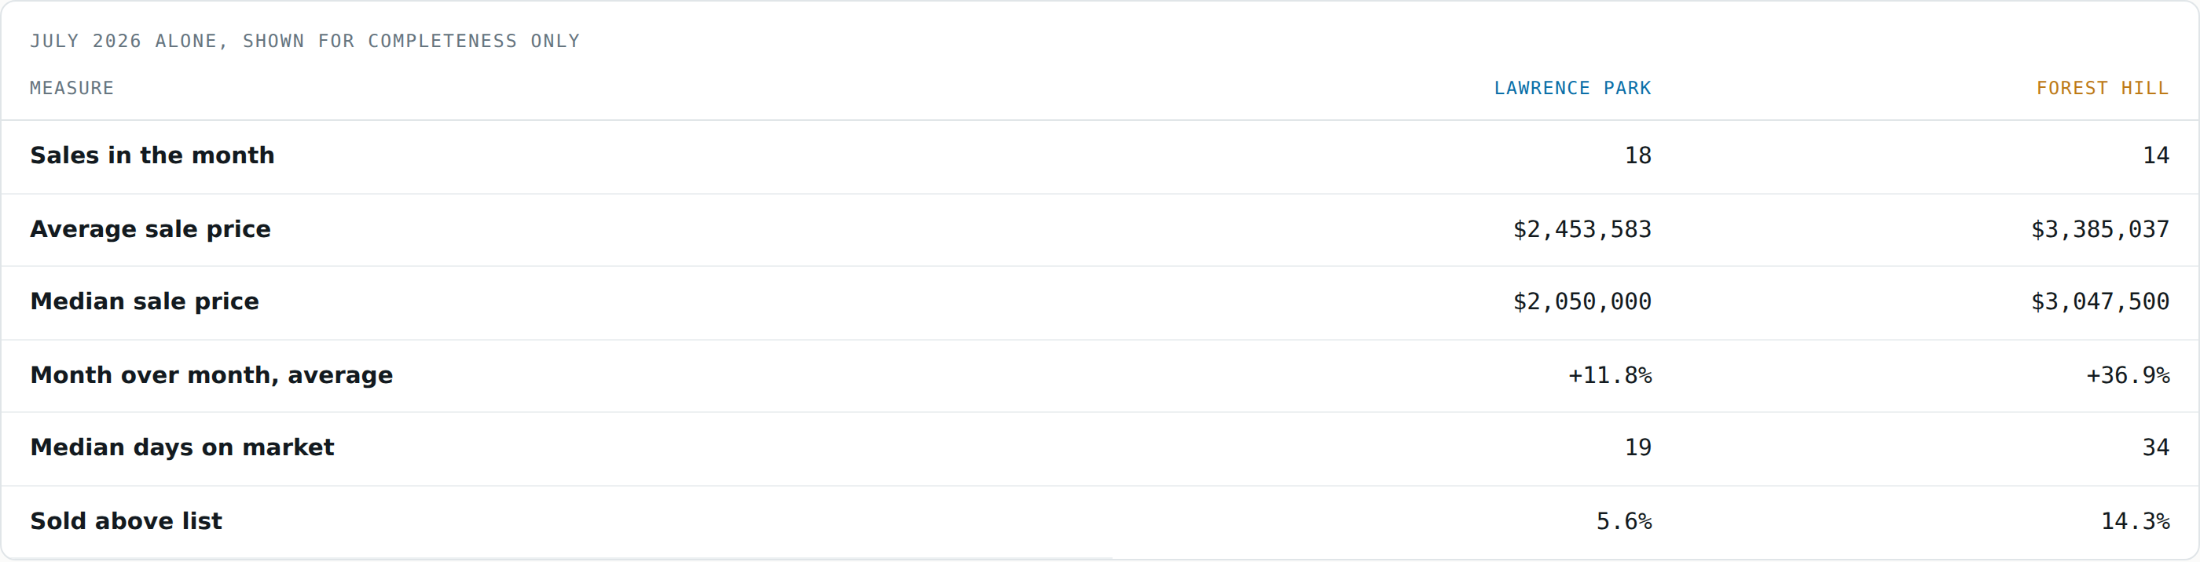
July 2026 alone shows Forest Hill's average price up 36.9% month over month and its median up 47.8%. Those are not real moves. They rest on 14 sales. Lawrence Park's month rests on 18. At that sample size, two large houses closing in the same month move the average more than the market does.
This is why everything above is year to date. 91 and 189 sales are enough to say something. 14 and 18 are not, and any report that leads with a monthly swing on a single neighbourhood is selling you volatility as insight.
Schools, shops and transit
Real estate data explains price. It does not explain why people stay. Both areas are anchored by long established public schools and small retail villages rather than malls, and both have subway access, but the shape of each is different.
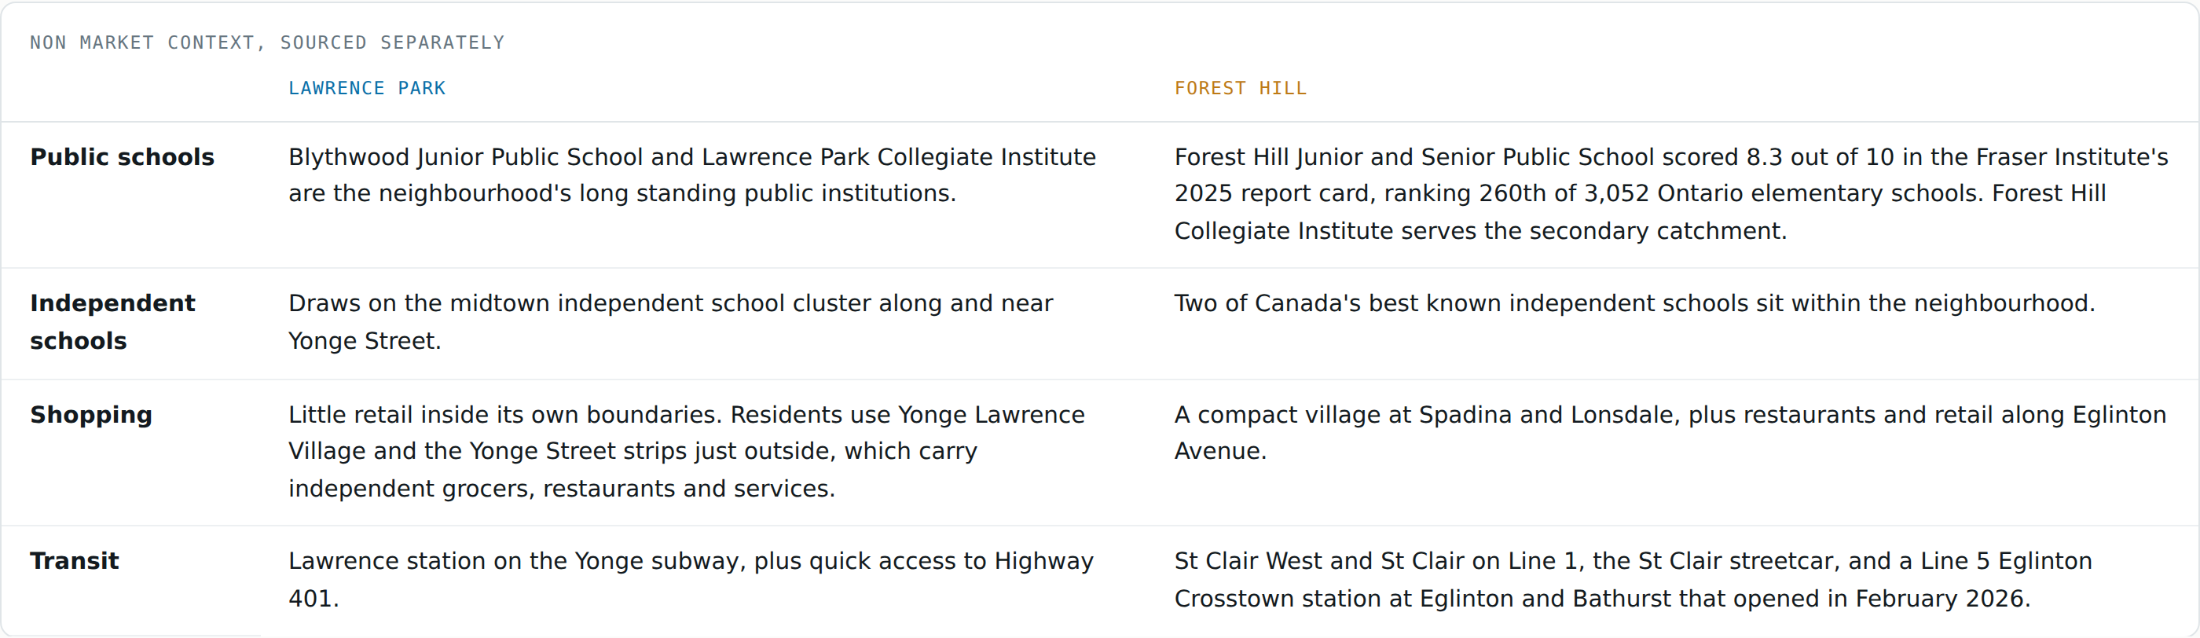
I could not find a comparable Fraser Institute score for the Lawrence Park elementary catchment at the time of writing, so I have not quoted one. Where I do not have the number, I would rather say so than estimate it.
The Crosstown station is the one item here that could move numbers rather than describe them. It opened in February 2026, five months before this data, and new transit usually takes longer than that to show up in sale prices. If you believe it will, Forest Hill is the side of that bet. I would want another two or three quarters before I called it.
So which one would I buy
It depends on which risk you would rather carry, and I would not pretend otherwise. Here is how I would put it to a client sitting across from me.
Buy Lawrence Park if:
You care most about being able to sell
It is the deeper market, at more than double the transaction count and nearly double the dollar volume. It sells faster, closer to asking, and with a quarter of sales above list. Its median is up 15.0% year to date against 10.0%, which matters because the median is harder to distort with one or two large sales than the average is.
This is the choice if your horizon might change, or if you would need to exit inside a soft market.
Buy Forest Hill if:
You have patience and want the discount
81.3% of sales close below asking and the average concedes 4.2% off list, so there is genuine room to negotiate. Supply is tightening faster, with new listings down 16.0% against 5.9%. Its share of above asking sales more than doubled from 6.6% to 14.3% in a year, which is the signal to watch.
This is the choice if you can wait for the right house, negotiate hard, and hold through a slower resale.
If you are selling in either:
Price it for the six in ten that fail
Most listings in both neighbourhoods come off the market without selling. That is the base rate you are up against, and it is almost always a pricing decision rather than a marketing one. Forest Hill sellers in particular should look at how their asking price compares to what has actually closed, not to what else is currently listed.
One limit worth being straight about: this data covers sales, not rents. Everything above is a read on capital and resale, not on yield. If you are buying to rent, the rental numbers are a separate exercise and I would not guess at them from this. And nothing here is a prediction. Past market behaviour is not a promise about what either neighbourhood does next.
Sources
MLS market report, Lawrence Park North and South (Toronto C04), July 2026 and year to date. 18 sales in month, 189 YTD.
MLS market report, Forest Hill North and South (Toronto C03 and C04), July 2026 and year to date. 14 sales in month, 91 YTD.
Listing turnover by month of listing, both areas, October 2023 to July 2026. Off market percentages averaged across the monthly cohorts from March 2025 to February 2026, unweighted by cohort size. Cohorts after February 2026 are excluded because recent listings have not had time to resolve.
Fraser Institute, Report Card on Ontario's Elementary Schools 2025, published January 2026.
Neighbourhood retail and transit descriptions compiled from public neighbourhood and transit references, August 2026. Line 5 Eglinton Crosstown opening date reported as February 2026.
Figures are as reported at the time of extraction and will move as sales close and listings resolve. All price figures are sale prices unless the row says list price.
Ali Bolourchi, BSc, MS, PSA, ABR®, Broker · REMAX® Your Community Realty, Brokerage*

Comments:
Post Your Comment: