June is the month the second half showed up early. Sales surged 9.4% year-over-year — the strongest annual gain of the cycle — while new listings fell another 12.9% and the pace of price declines kept shrinking. The turn is no longer a forecast. It is in the data.
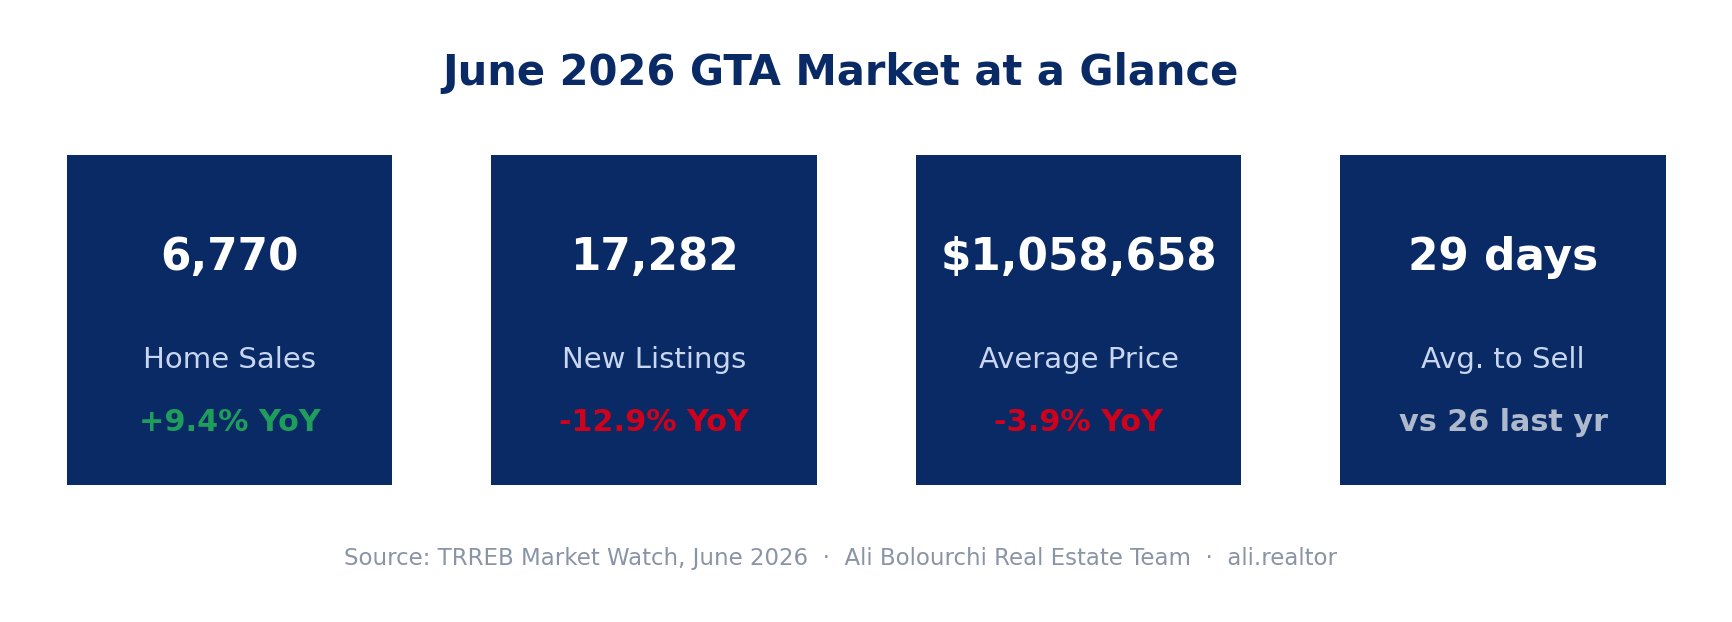
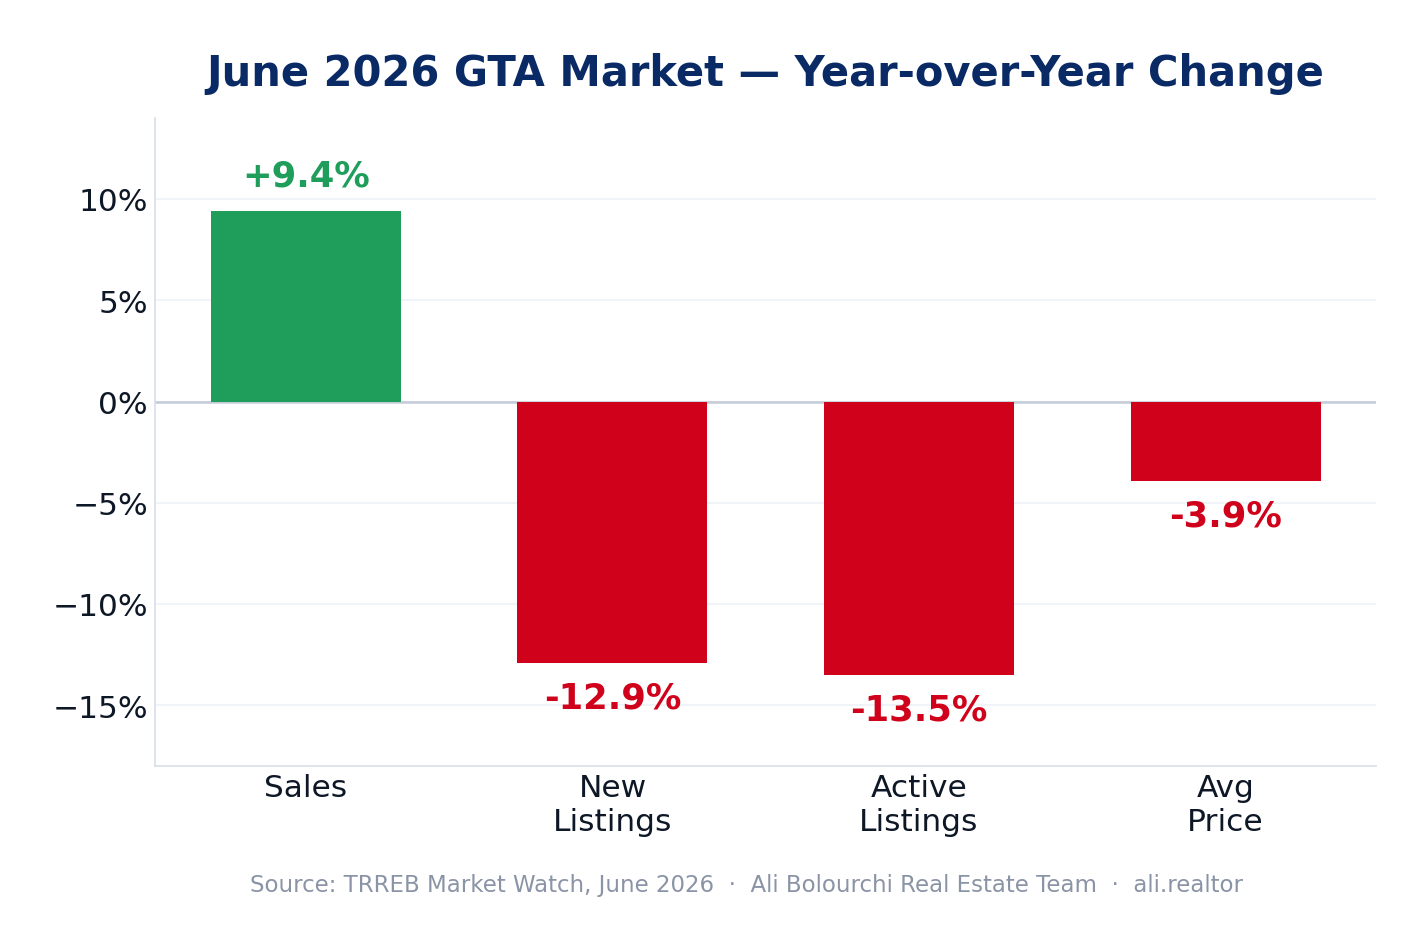
According to the latest TRREB Market Watch (released July 3, 2026), the GTA recorded 6,770 home sales in June 2026, up 9.4% year-over-year, while new listings fell 12.9% to 17,282. Active inventory is down as well — 27,329 active listings, a 13.5% year-over-year drop. On a seasonally adjusted, month-over-month basis, June sales rose versus May while new listings fell, and both the average selling price and the MLS® HPI Composite ticked up. When demand climbs and supply retreats at the same time, this is exactly the print you expect.

The price story is the one to watch. The average selling price came in at $1,058,658, down just 3.9% year-over-year — a materially smaller decline than the 6%-plus gaps we were reading earlier in the year. The MLS® HPI Composite benchmark was down 5.4%. As TRREB’s Chief Information Officer put it, “the annual rate of decline has receded over the past few months” and, if tightening continues, selling prices could move in line with 2025 and eventually post increases. Translation: the floor is forming in real time. Here is exactly where the market stands by property type — and what every buyer, seller, and investor should do about it.
June 2026 GTA market at a glance
Sales climbing while supply and price retreat — the tightening in one picture
Detached Homes
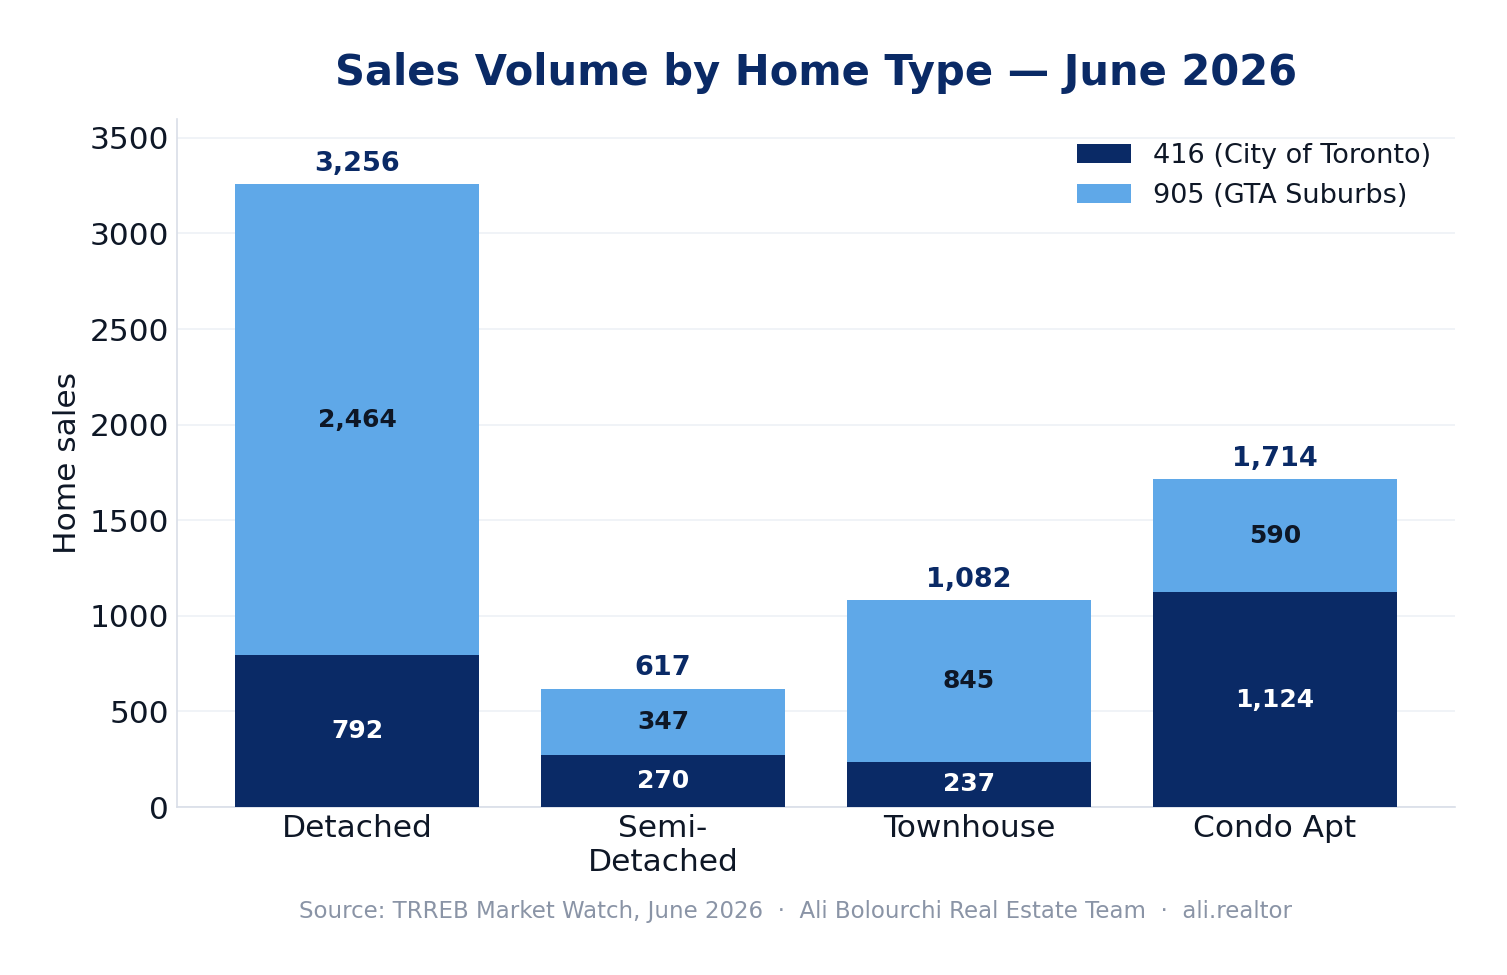
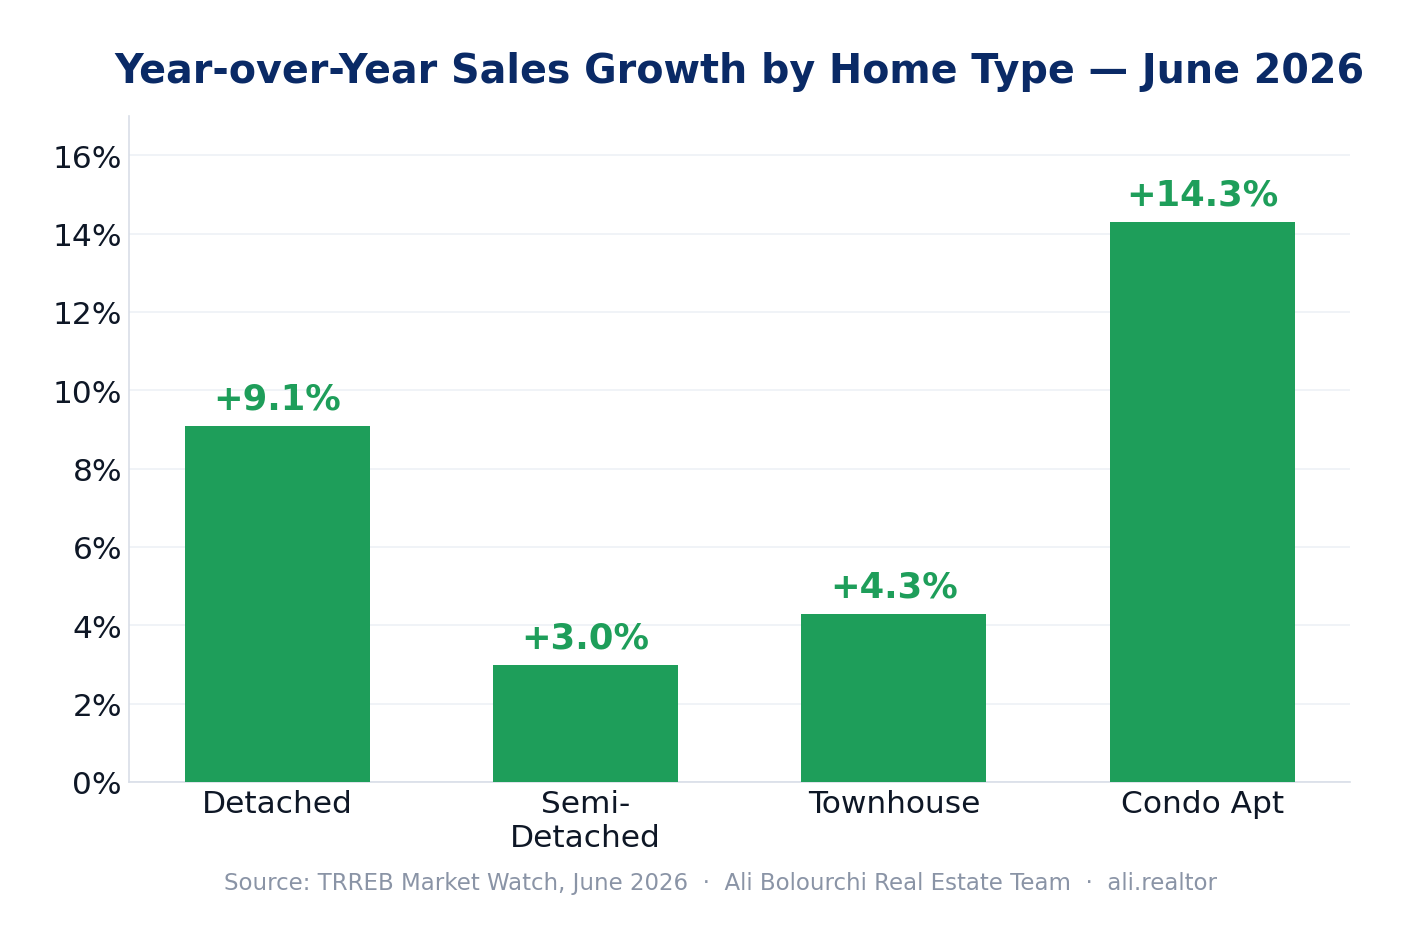
Detached homes led the market again, posting 3,256 sales — 48% of all GTA transactions and a 9.1% year-over-year sales gain. Demand for the region’s benchmark asset class is broad and accelerating, and it is happening while detached prices sit essentially flat to modestly lower than 2025. Improved affordability from lower borrowing costs is pulling buyers back into the segment at scale.
416 (City of Toronto)
Sales: 792 transactions in June 2026 (up 0.4% year-over-year).
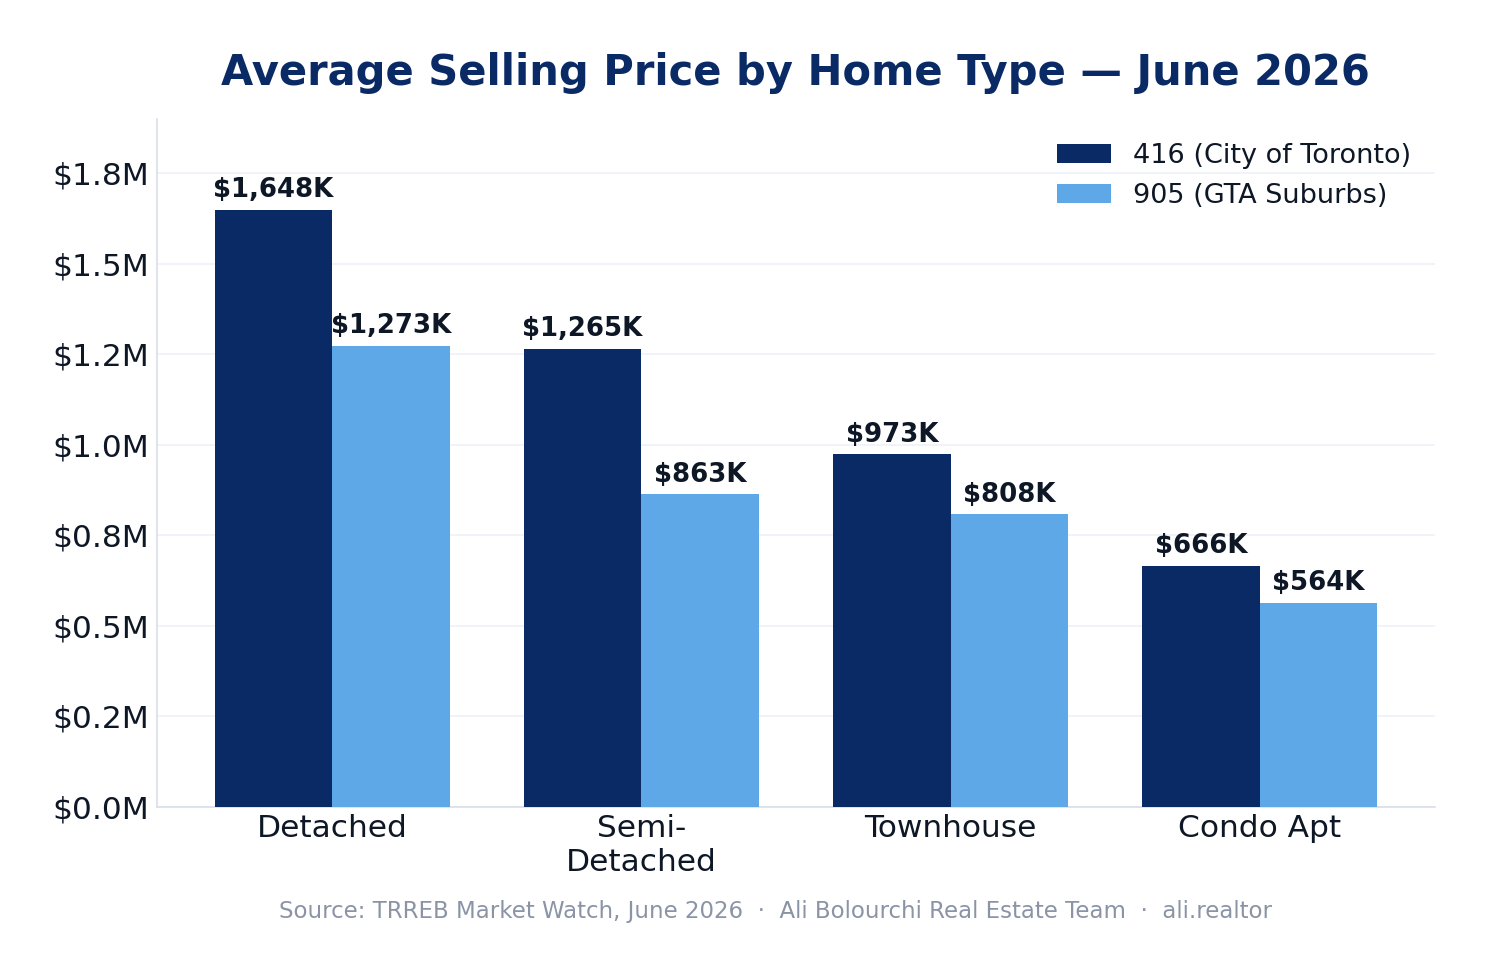
Average Price: $1,648,440 — up 0.3% year-over-year.
Trend: City detached is one of only two segments in the entire report with a positive year-over-year price move. Prices holding above last year while sales rise is a clear tightening signal.
905 (GTA Suburbs)
Sales: 2,464 transactions in June 2026 (up a strong 12.3% year-over-year).
Average Price: $1,272,842 (down just 2.2% year-over-year).
Trend: The suburbs are the volume engine. Double-digit sales growth paired with a price decline of only 2.2% means 905 detached has effectively found its floor — and buyers are competing for it.
Insight: The 905 detached number is the tell this month — 12.3% sales growth against a 2.2% price dip is a market absorbing inventory fast. For sellers who held off through 2025, listing into a market with 12.9% fewer competing listings is the strongest case in the cycle. For buyers, the “wait for a deeper correction” thesis has run out of runway.
Where the volume is: sales by home type, 416 vs 905
Semi-Detached Homes
Semi-detached homes — the “missing middle” that structurally cannot be replaced — produced 617 sales in June, up 3.0% year-over-year. The 416 held its price within roughly a point of last year, while the 905 kept posting the sales growth.
416 (City of Toronto)
Sales: 270 transactions in June 2026 (down 3.2% year-over-year).
Average Price: $1,264,782 (down just 1.1% year-over-year).
Trend: Among the most price-stable segments in the GTA. A softer sales count here is a supply story, not a demand story — owners are holding these scarce city semis.
905 (GTA Suburbs)
Sales: 347 transactions in June 2026 (up 8.4% year-over-year).
Average Price: $863,272 (down 6.7% year-over-year).
Trend: The value play for move-up buyers. Suburban semis under $875K remain one of the best freehold entry points in the region, and sales are responding.
Insight: A 416 semi holding within 1.1% of last year’s price while the broader market is down 3.9% is the scarcity premium reasserting itself. Move-up buyers who want freehold ownership in the city without the detached price tag should act here first. For 905 sellers, the buyers are showing up at the right price — pricing discipline is what converts them.
Townhouses
Townhouses recorded 1,082 sales in June 2026, up 4.3% year-over-year, and continue to attract the widest buyer demographic — young families, downsizers, and first-time buyers chasing ground-level living without a detached price tag.
416 (City of Toronto)
Sales: 237 transactions in June 2026 (down a marginal 0.4% year-over-year).
Average Price: $973,232 — up 1.5% year-over-year.
Trend: The second segment in the report with positive year-over-year price growth. Well-located city townhouses are scarce, and that scarcity is now showing up in price.
905 (GTA Suburbs)
Sales: 845 transactions in June 2026 (up 5.8% year-over-year).
Average Price: $808,495 (down 4.4% year-over-year).
Trend: The volume engine of the segment — accessible price points and steady sales growth as families choose the space-to-price ratio.
Insight: A 416 townhouse price up 1.5% year-over-year, while the region is still slightly negative, tells you where the competition is concentrating. If you own a properly located Toronto townhouse — Leslieville, The Junction, Roncesvalles, Riverdale — you are listing into a market starved for your product. List with discipline; the buyers are waiting.
Average selling price by home type — the 416 premium at a glance
Condo Apartments
The condo apartment segment was the sales surprise of the month, posting 1,714 sales — up roughly 14% year-over-year and 25% of all GTA transactions. With an average price of $630,688, condos remain the most accessible entry point into GTA homeownership, and after multiple quarters of correction, buyers are moving decisively against the value.
416 (City of Toronto)
Sales: 1,124 transactions in June 2026 (up sharply, ~14% year-over-year).
Average Price: $665,760 (down 9.0% year-over-year).
Trend: The downtown and waterfront reset continues to convert into transactions. Steady, durable demand at meaningfully lower entry pricing.
905 (GTA Suburbs)
Sales: 590 transactions in June 2026 (up sharply, ~14% year-over-year).
Average Price: $563,874 (down 10.6% year-over-year — the steepest price decline in the report).
Trend: Sub-$575K suburban product is being absorbed by first-time buyers priced out of freehold.
Insight: Condo sales jumping ~14% while prices are still down 9–11% year-over-year is the textbook bottom-formation pattern — rising volume meeting falling price is how a floor gets built. With the Bank of Canada at 2.3%, condo prices well off their 2022 peak, and new-listing supply contracting region-wide, this is the alignment professional investors wait for. If you are positioning a condo for a 3-to-5-year horizon, the entry window is closing in real time.
Every property type is up year-over-year — condos leading the charge
Pace of the Market
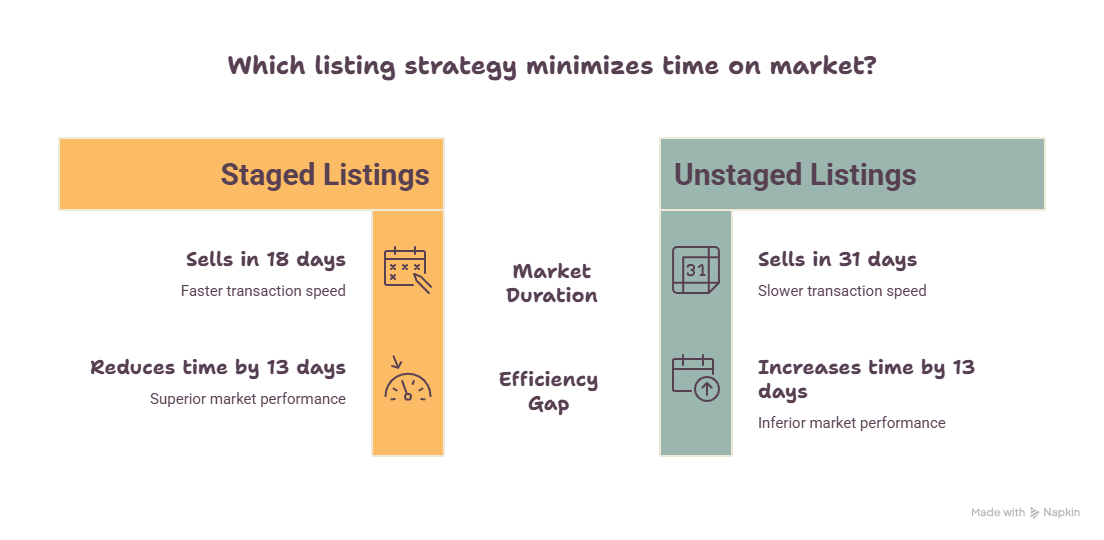
Homes are still giving buyers a moment to think — but the clock is speeding up. The average property took 29 days to sell (list date to sale date) in June, up from 26 days a year ago, while the average time on market across a full listing cycle held at 42 days. Read alongside a sales-to-new-listings ratio that has climbed to roughly 39% (6,770 sales against 17,282 new listings), the direction is unambiguous: fewer homes are coming to market, and the ones that do are being absorbed faster than last year.
Economic Backdrop
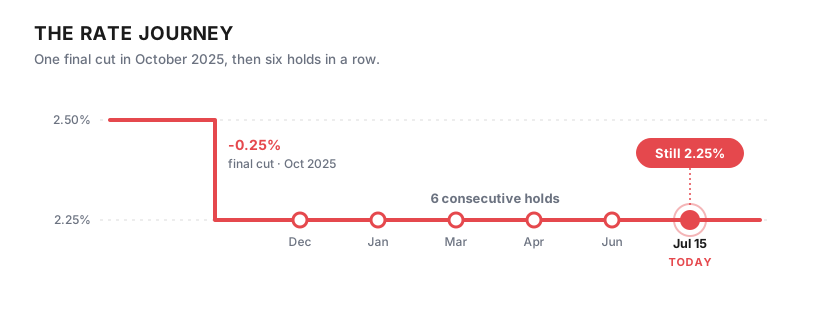
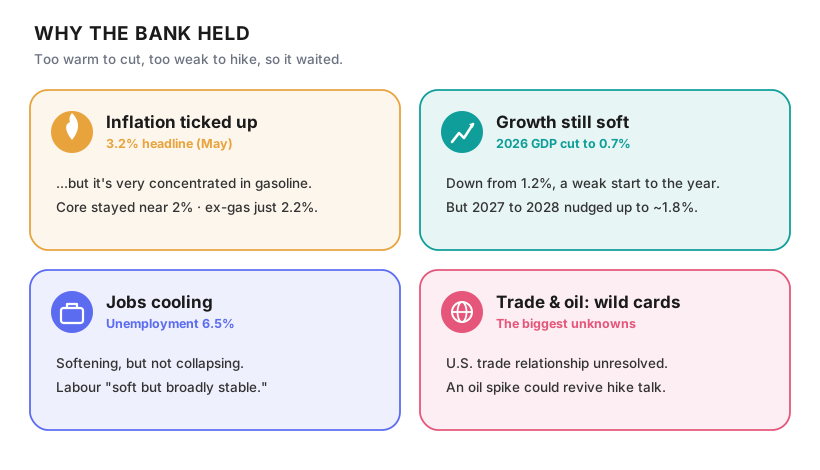
The macro picture continues to support the shift. The Bank of Canada’s overnight rate is holding at 2.3%, with prime at 4.5%. Mortgage rates sit at 5.49% (one-year), 6.05% (three-year), and 6.09% (five-year). Inflation is running at 3.2% (May CPI), and Toronto employment grew 0.7% in May — though the Toronto unemployment rate remains elevated at 7.6% and real GDP was essentially flat in Q1 (-0.1% annualized). Those crosscurrents are exactly why some would-be sellers stayed on the sidelines — and why new listings have fallen faster than sales.
TRREB President Daniel Steinfeld framed the year directly: “After a slow start in the first quarter, we saw a marked improvement in home sales in the second quarter of this year. This result followed TRREB’s 2026 outlook, which called for a year of two halves. We expect accelerating transactions and more competition between buyers in the last six months of the year, helping to satisfy pent-up demand and ultimately resulting in renewed price growth.”
Chief Information Officer Jason Mercer added: “While the average selling price was still down year-over-year in June, the annual rate of decline has receded over the past few months. If market conditions continue to tighten in the second half of 2026, selling prices could move in line with 2025 and eventually post some increases. This would give an increasing number of households the confidence to move back into the marketplace.” The signal for buyers reading this today: a market that is already tightening is expected to tighten further — with renewed price growth openly on the table.
What This Means for You
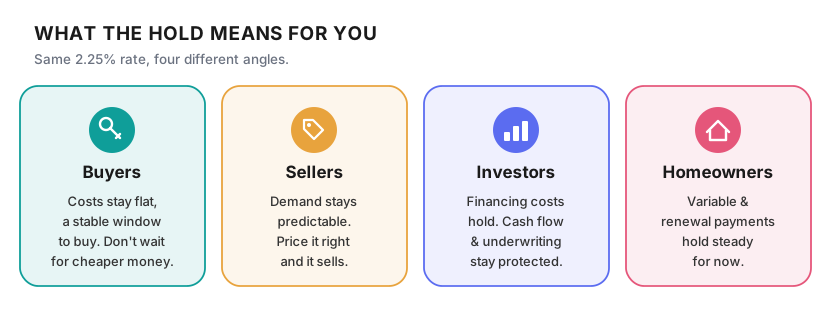
If You Are a Buyer: The window of maximum leverage is narrowing faster than it was a month ago. Sales are up 9.4% year-over-year, new listings are down 12.9%, active inventory is down 13.5%, and prices rose month-over-month on a seasonally adjusted basis. The rate of annual price decline has shrunk to 3.9%, and TRREB is openly discussing price growth. The combination of prices still below 2025, a Bank of Canada at 2.3%, and a genuine supply squeeze does not last. If you have been waiting for confirmation that the bottom is in, this report is it — and the cost of waiting another quarter is now measurable.
If You Are a Seller: You are in the strongest position you have held since 2022. New listings are down 12.9% year-over-year and active inventory is down 13.5% — well-priced, well-presented homes are facing dramatically less competition than a year ago, and they are selling three days faster. City detached and city townhouses are already posting positive year-over-year price growth. If you have been deferring a listing decision, the second-half window is open right now. Buyers are still informed, so pricing discipline matters — but the leverage has clearly shifted toward you.
If You Are an Investor: Condo apartments posting ~14% sales growth at 9–11% lower year-over-year pricing is textbook bottom-formation. Rates are accommodative, structural housing supply remains constrained, and GTA rental demand fundamentals are robust. For 3-to-5-year horizons, this is the entry environment professional investors wait years for. Move with discipline — but move.
Ready to Act on This Market?
Whether you are buying your first home, executing a strategic move-up, listing a property you have held for years, or building an investment portfolio — the June 2026 data is unambiguous. The second half has arrived early, and the supply squeeze is accelerating it. The only question is what you do with that information.
I work with buyers, sellers, and investors across the GTA — from first-time purchases to complex multi-property transactions — and I am here to help you navigate this market with precision and confidence. Let’s talk about exactly what this data means for your situation, your timeline, and your numbers.