The Canadian real estate landscape is experiencing its most critical milestone yet. For over 1.2 million households navigating the historic 2026 Mortgage Cliff, renewing a loan is no longer a simple paperwork exercise. Moving from pandemic-era rates under 2% into today's restructured market requires clear data and a methodical approach.
Instead of facing this transition with anxiety, we can view it as a design problem to be solved with logic. This definitive guide outlines the step-by-step process of securing your equity, dissects the modern mechanics of Fixed vs. Variable rates, and highlights what you must look for before signing your name.
Step 1: The Timeline — Plotting Your Market Entry
Lenders rely on the "convenience trap." By law, banks are only required to send your renewal notice 21 days before your maturity date. They expect you to panic and sign their baseline offer. To protect your net wealth, your timeline must begin much earlier.
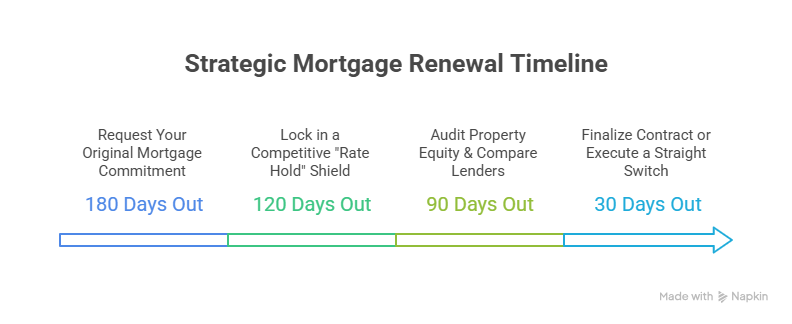
180 Days Out: Request a copy of your original mortgage commitment letter from your current lender. You need to identify how your mortgage was registered (Standard vs. Collateral Charge).
120 Days Out: Secure a formal Rate Hold with an independent broker or alternative lender. This acts as a free financial option, locking in a ceiling to protect your household budget against bond market spikes while letting you float down if rates drop before your maturity date.
Step 2: Choose Your Engine — Fixed vs. Variable Rate Mechanics
The single most critical choice you will make is how your loan behaves over the next term. In today's market, the gap between these two options involves different pricing engines and distinct structural risks.
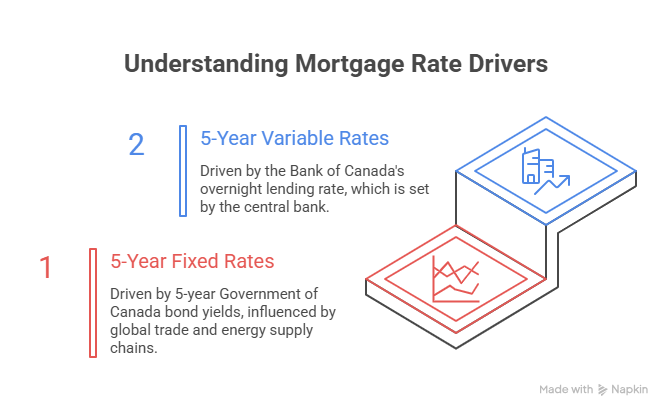
The 2026 Rate Landscape
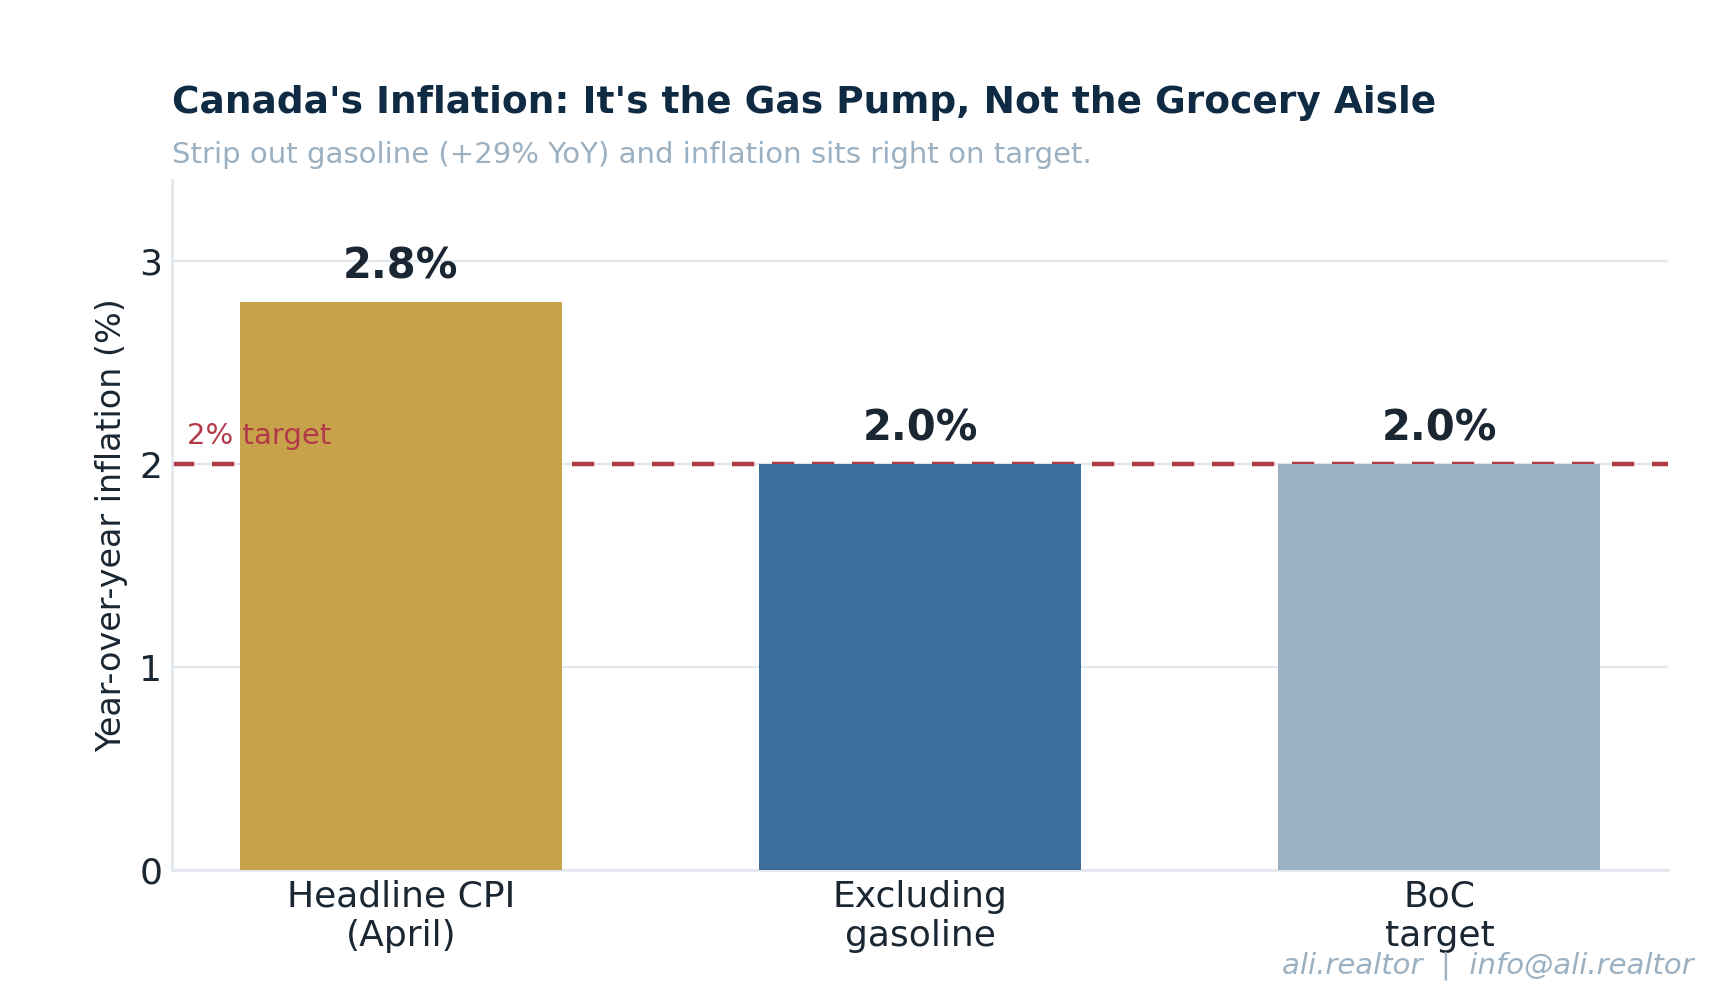
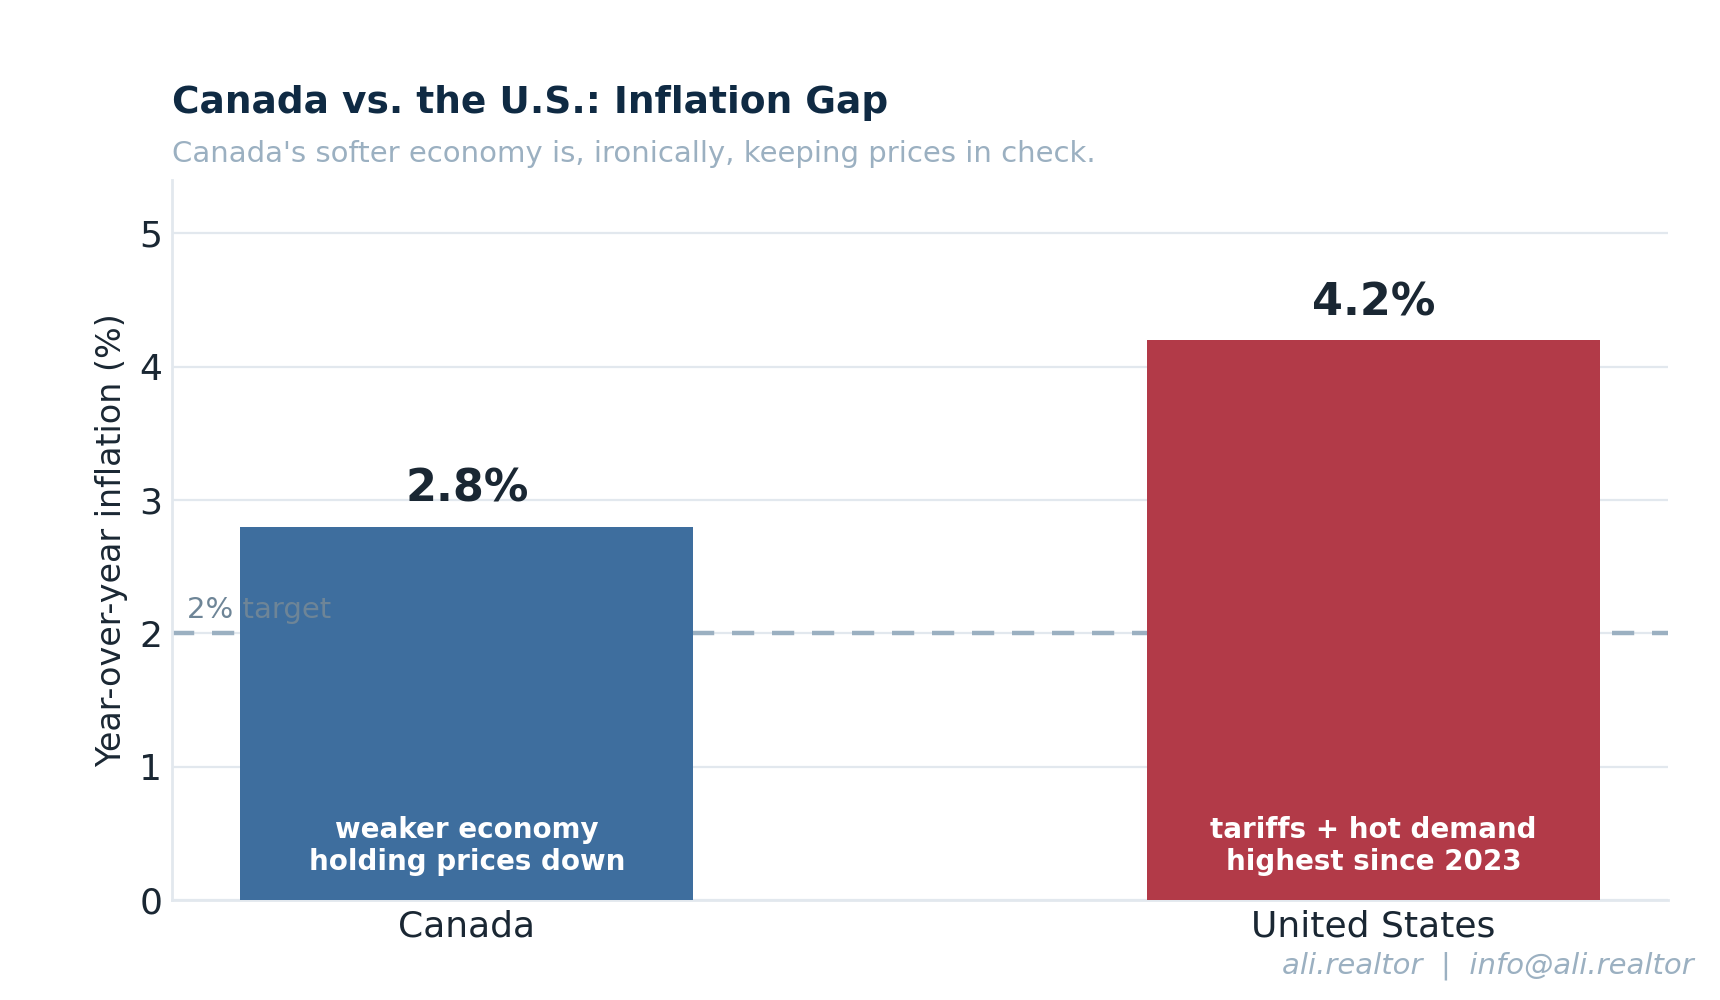
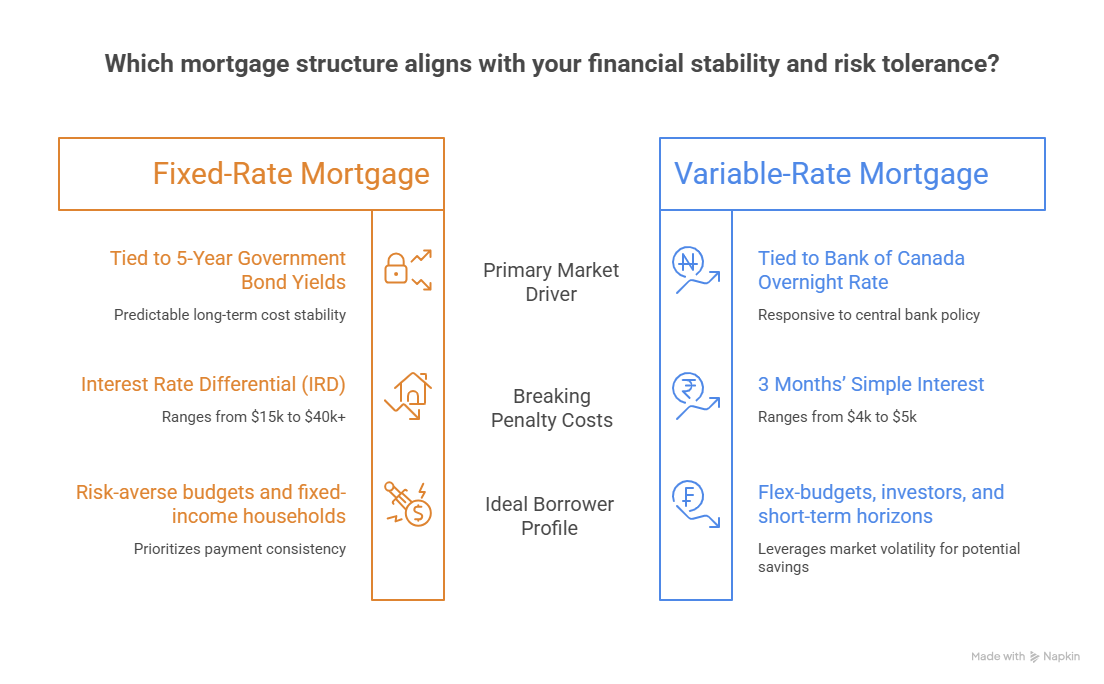
5-Year Fixed Rates (~3.84% – 4.04%): Driven directly by 5-year Government of Canada bond yields, which have experienced volatility due to global trade tariffs and energy supply chain adjustments.
5-Year Variable Rates (~3.30% – 3.35%): Driven directly by the Bank of Canada's overnight lending policy rate (sitting at 2.25%).
To determine which path suits your lifestyle narrative, evaluate the pros, cons, and financial trade-offs of each structure:
1. Fixed-Rate Mortgages
The Strategy: Your interest rate and monthly payment remain entirely locked for the duration of your term (e.g., 3 or 5 years).
The Pros: Complete psychological peace of mind. Your budget is entirely shielded from sudden inflation shocks or international market movements.
The Cons: Total structural rigidity. If the Bank of Canada cuts rates further, you are trapped at your higher rate. Most importantly, if you need to sell your property or refinance mid-term, the bank calculates your penalty using the Interest Rate Differential (IRD), which frequently leads to five-figure penalties.
2. Variable-Rate Mortgages (VRM vs. ARM)
The Strategy: Your interest rate fluctuates based on lender prime rates, which move in tandem with the Bank of Canada.
The Pros: Historically, variable rates tend to cost less over the lifetime of a standard loan. Right now, variable rates offer a notable discount compared to fixed options. Breaking a variable mortgage carries a transparent, predictable penalty capped at just 3 months' simple interest.
The Cons: If domestic inflation experiences a sudden uptick, your borrowing costs will climb. You must ensure you have the financial flexibility to manage fluctuating interest environments.
Structural Comparison Matrix
Step 3: Look Out for the Hidden Details
Beyond the headline interest rate, a mortgage is a legal structure that can either grant you long-term freedom or restrict your options. Here are three critical details you must look out for:
1. The VRM vs. ARM "Trigger Rate" Blueprint
If you opt for a variable rate, look at how the payment handles changes. An Adjustable-Rate Mortgage (ARM) shifts your payment automatically as prime changes, keeping your amortization on schedule. A Variable-Rate Mortgage (VRM) keeps your monthly payment identical, but shifts how much of that money goes to principal vs. interest.
What to look out for: If rates rise, a VRM can hit its Trigger Rate—the point where your payment fails to cover the basic interest. Lenders will then require an immediate lump-sum payment or trigger negative amortization, where your debt grows every month.
2. Standard Charges vs. Collateral Charges
Look at your original registration documentation. A Standard Charge registers the exact amount you owe. A Collateral Charge allows big banks to register up to 125% of your home's total value on title.
What to look out for: While collateral charges make borrowing extra equity simpler, they cannot be transferred to a competitor seamlessly at renewal. Moving them requires $600 to $1,000 in legal title re-registration fees, reducing your negotiating leverage.
3. The New OSFI "Straight-Switch" Rule
The financial regulator updated guidelines to give Canadian consumers more freedom. If you execute a "straight switch"—meaning your remaining balance and amortization period stay completely identical—you no longer have to pass the formal mortgage stress test to change lenders.
What to look out for: Banks often hide this fact. If a competing lender offers a lower rate, you can move your mortgage over without the old "Contract Rate + 2%" qualifying hurdle.
Step 4: The Execution — Your Path to Leverage
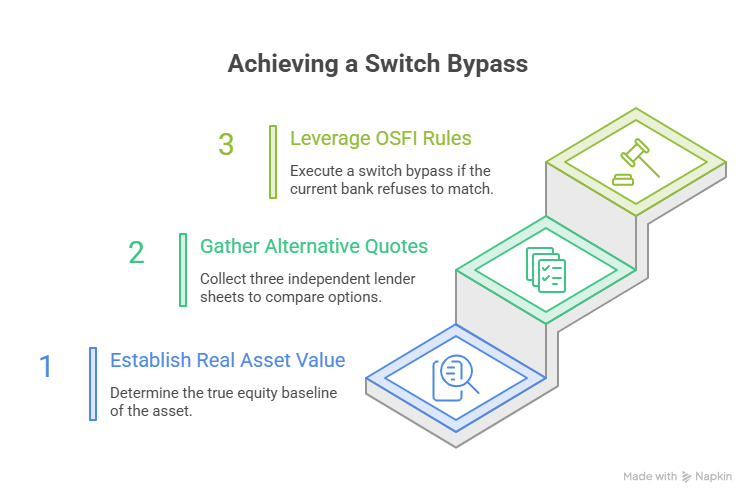
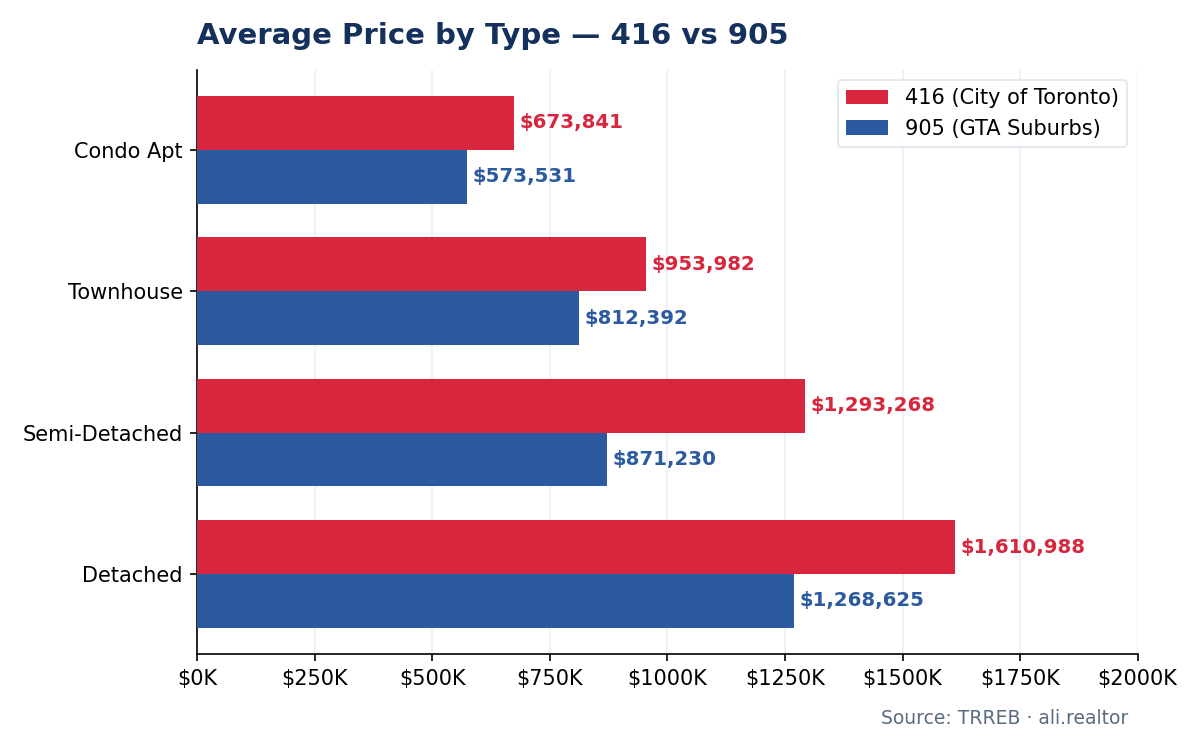
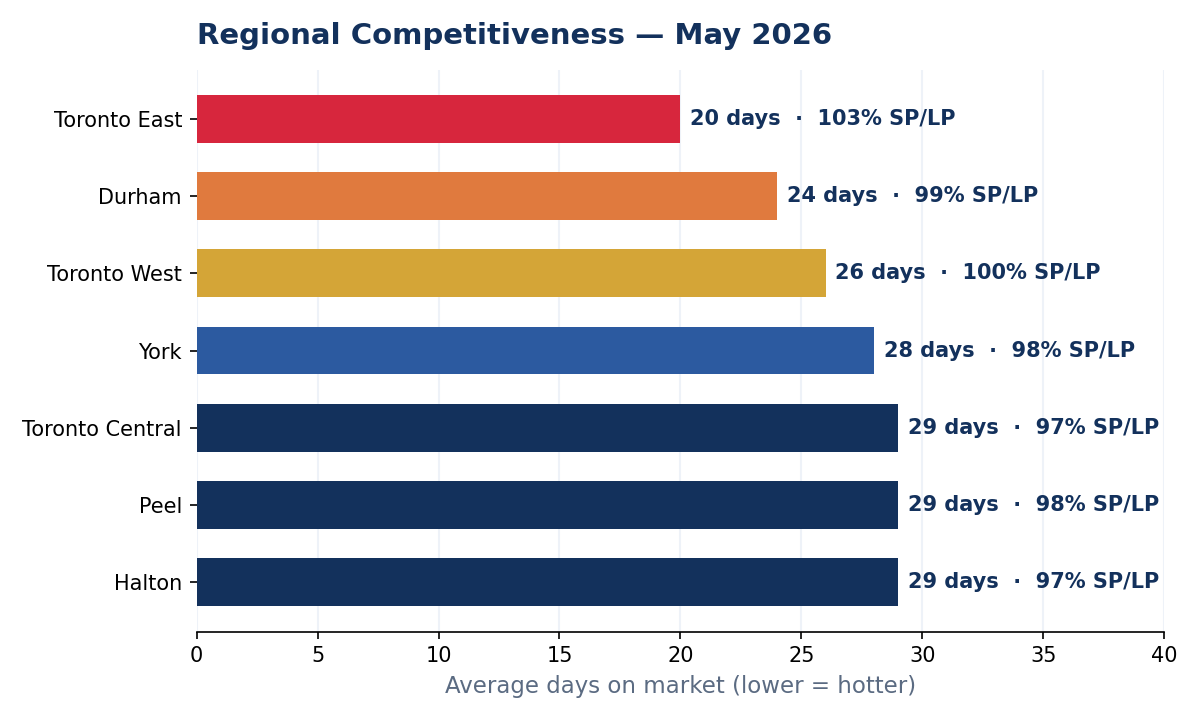
To successfully negotiate with your current bank or prepare for a straight switch to a competitor, you must first understand your true asset value. Your home equity is your ultimate leverage. If you don't know the exact current value of your property in the current GTA market, you are negotiating in the dark.
Instead of letting institutional timelines dictate your choices, take control of your financial position before it becomes an issue. Establishing your real-world equity baseline provides the precise data you need to make an informed, confident decision.
To discover where your property stands in today's landscape and secure the clarity required to negotiate with confidence, access our digital evaluation platform: