According to the latest TRREB Market Watch (released May 5, 2026), April 2026 delivered the clearest tightening signal we have seen in over a year. Sales jumped 7.0% year-over-year to 5,946 transactions, while new listings fell 9.3% to 17,097 and active listings dropped 6.4%. Most importantly: on a seasonally adjusted, month-over-month basis, the average selling price edged up versus March — the first directional reversal of the cycle. The MLS® HPI Composite was flat MoM. Prices may be finding their floor.
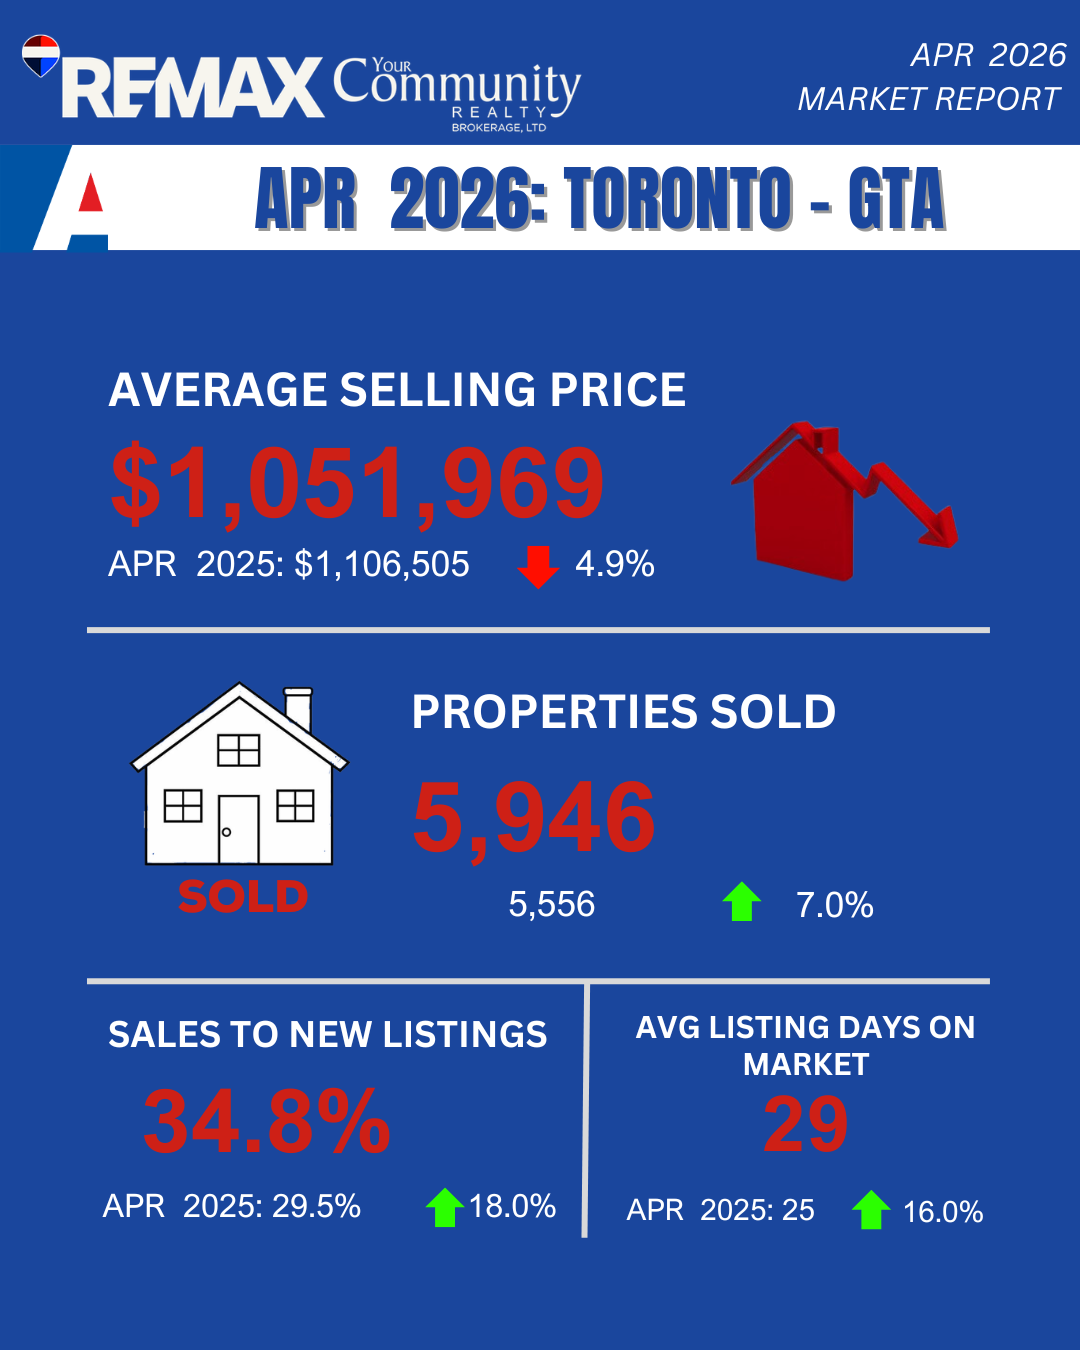
March hinted at it. April confirmed it. Sales are growing faster than listings, which is the textbook definition of a market shifting toward sellers. Through the first four months of 2026, the GTA has now recorded 17,862 total sales at a year-to-date average price of $1,018,849. Here is exactly where the market stands — and what every buyer, seller, and investor needs to do about it.
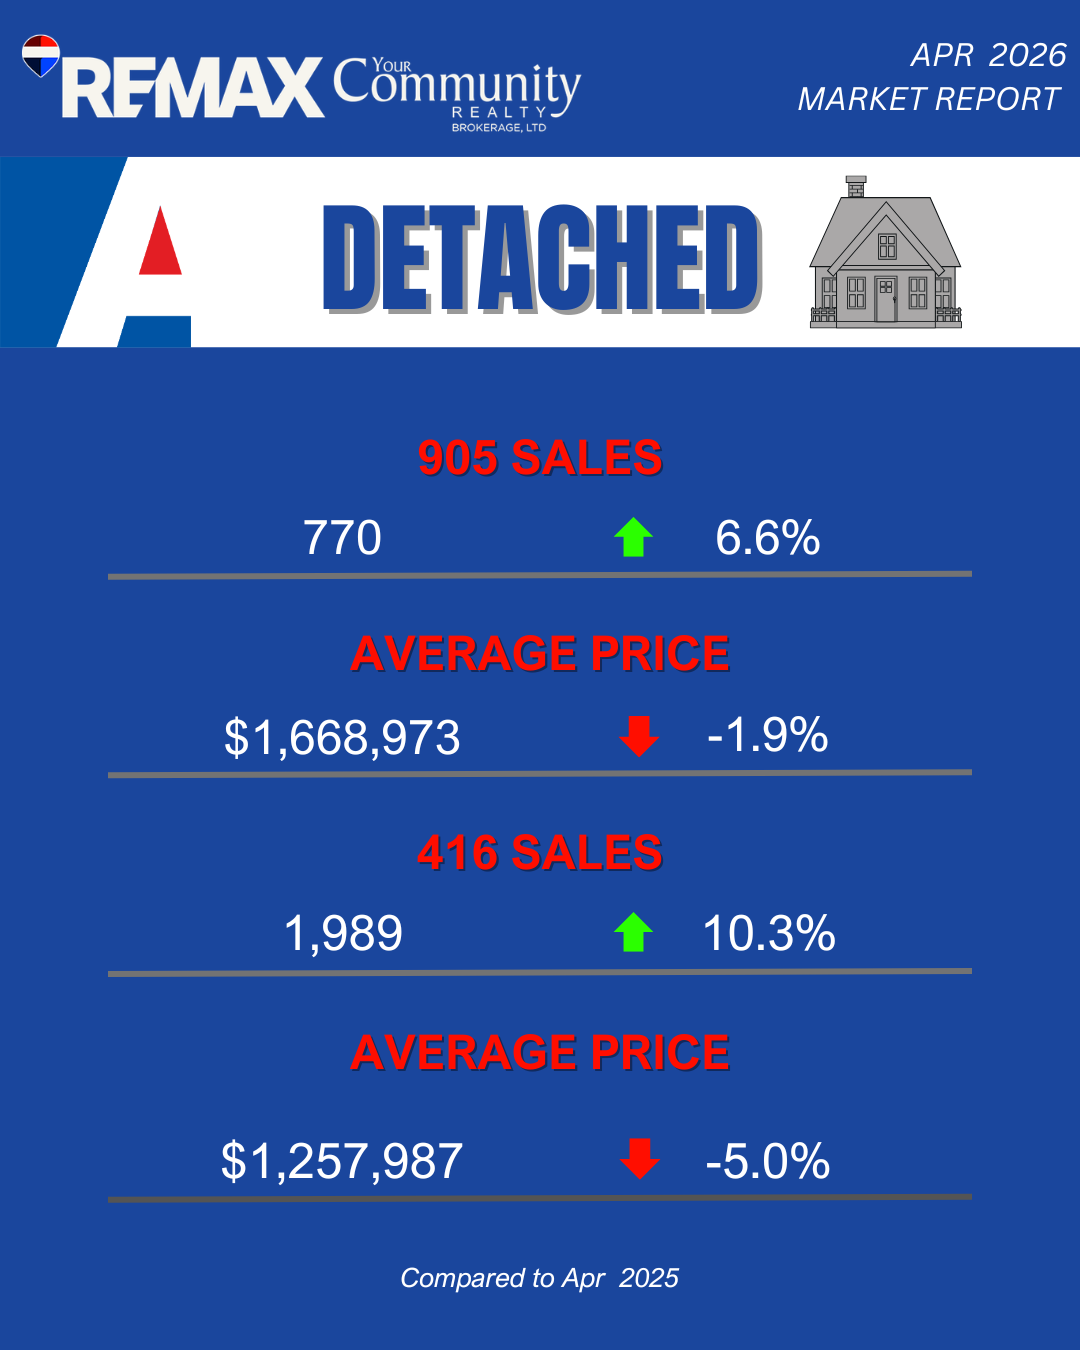
Detached Homes
Detached homes did the heavy lifting in April, posting 2,759 sales — 46.4% of all GTA transactions and a 9.2% year-over-year sales gain. This is the strongest segment-level demand recovery of any property type, and it is happening while detached prices remain meaningfully below 2025 levels. Buyers who priced themselves out in 2024–2025 peaks now have a viable runway back in.
416 (City of Toronto)
Sales: 770 transactions in April 2026.
Average Price: $1,668,973.
Trend: Prices are down 1.9% year-over-year — the most resilient detached price performance of the cycle. Sales rose 6.6% versus April 2025. City detached has effectively bottomed.
905 (GTA Suburbs)
Sales: 1,989 transactions in April 2026.
Average Price: $1,257,987.
Trend: Down 5.0% year-over-year on price — but sales surged 10.3%. Suburban detached buyer demand is now running at double-digit growth.
Insight: The 416 detached number is the one to watch. A 1.9% YoY price decline paired with 6.6% sales growth tells you the city's most coveted asset class is no longer correcting — it is rebuilding momentum. For sellers who held off through 2025, the case for listing now is stronger than it has been in 18 months. For buyers, the “wait for prices to fall further” thesis is officially expired.
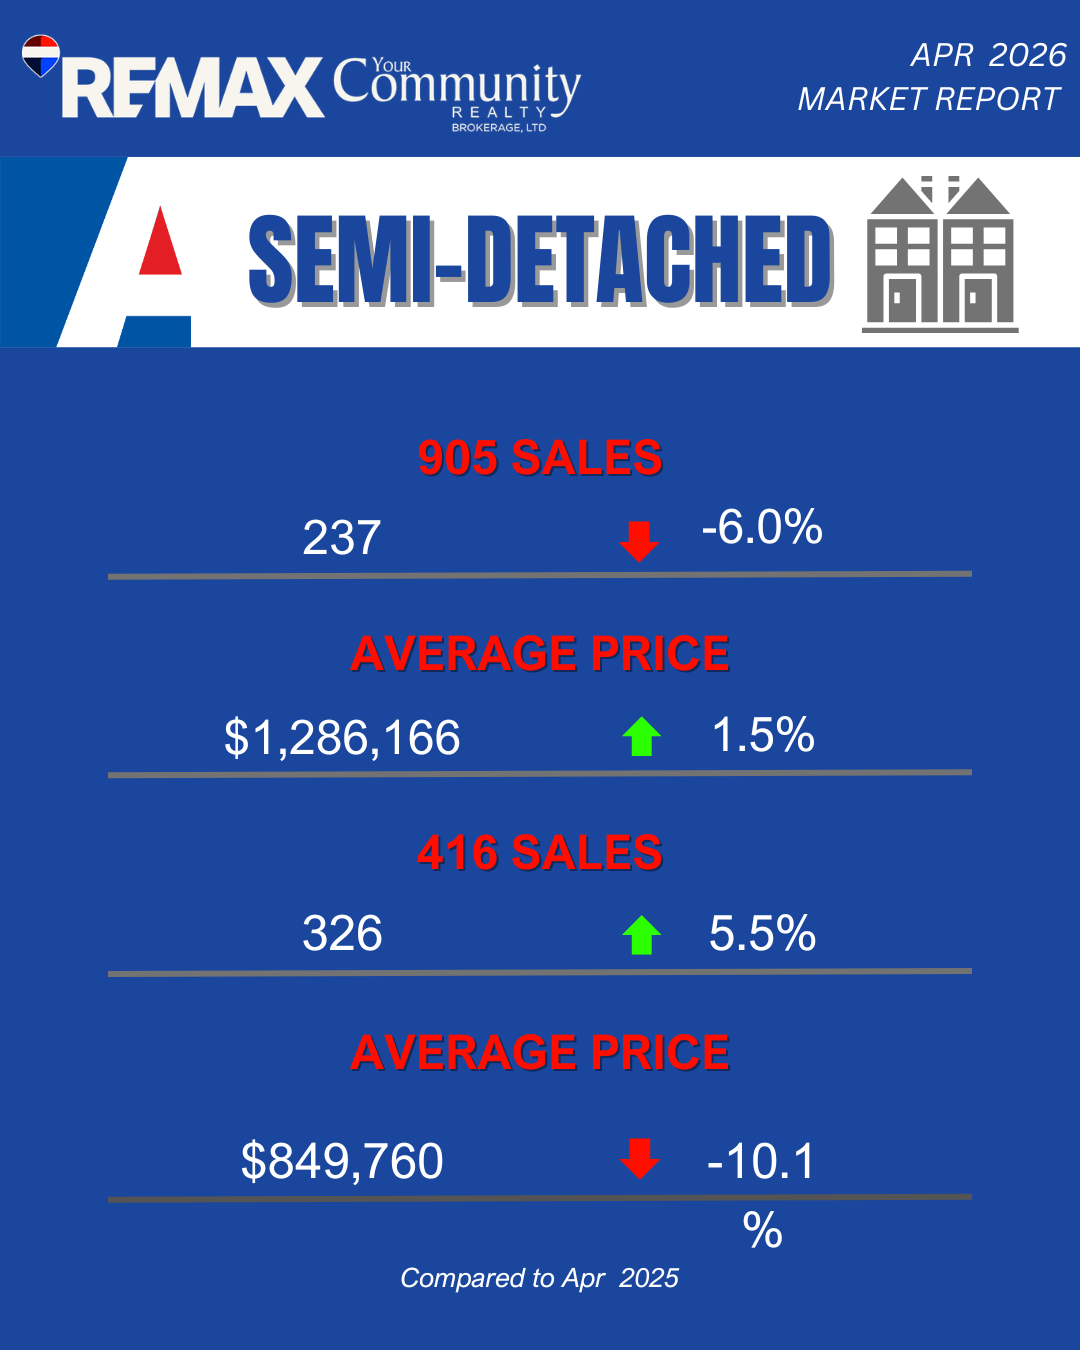
Semi-Detached Homes
Semi-detached homes — the “missing middle” segment TRREB’s leadership has flagged repeatedly — produced 563 sales in April. The standout story here is the 416, where prices actually rose year-over-year. With YTD-2026 average semi prices crossing $1 million, this segment is quietly proving that scarcity wins.
416 (City of Toronto)
Sales: 237 transactions in April 2026.
Average Price: $1,286,166.
Trend: Prices are up 1.5% year-over-year — the only major segment in positive YoY price territory. Sales eased 6.0% versus April 2025, but the price strength is the signal that matters: structural undersupply is reasserting itself.
905 (GTA Suburbs)
Sales: 326 transactions in April 2026.
Average Price: $849,760.
Trend: Down 10.1% year-over-year on price — the steepest decline in the freehold market — with sales up a strong 5.5%. The buyer logic is clear: 905 semis under $850K are being aggressively absorbed.
Insight: 416 semis posting positive YoY price growth in this market is a structural story, not a fluke. The city cannot build them — they exist as legacy stock in established neighbourhoods. For move-up buyers who want freehold ownership in the city without the detached price tag, this is the segment to act on first. For sellers in 905 semis, the volume is there at the right price — pricing discipline is what unlocks it.
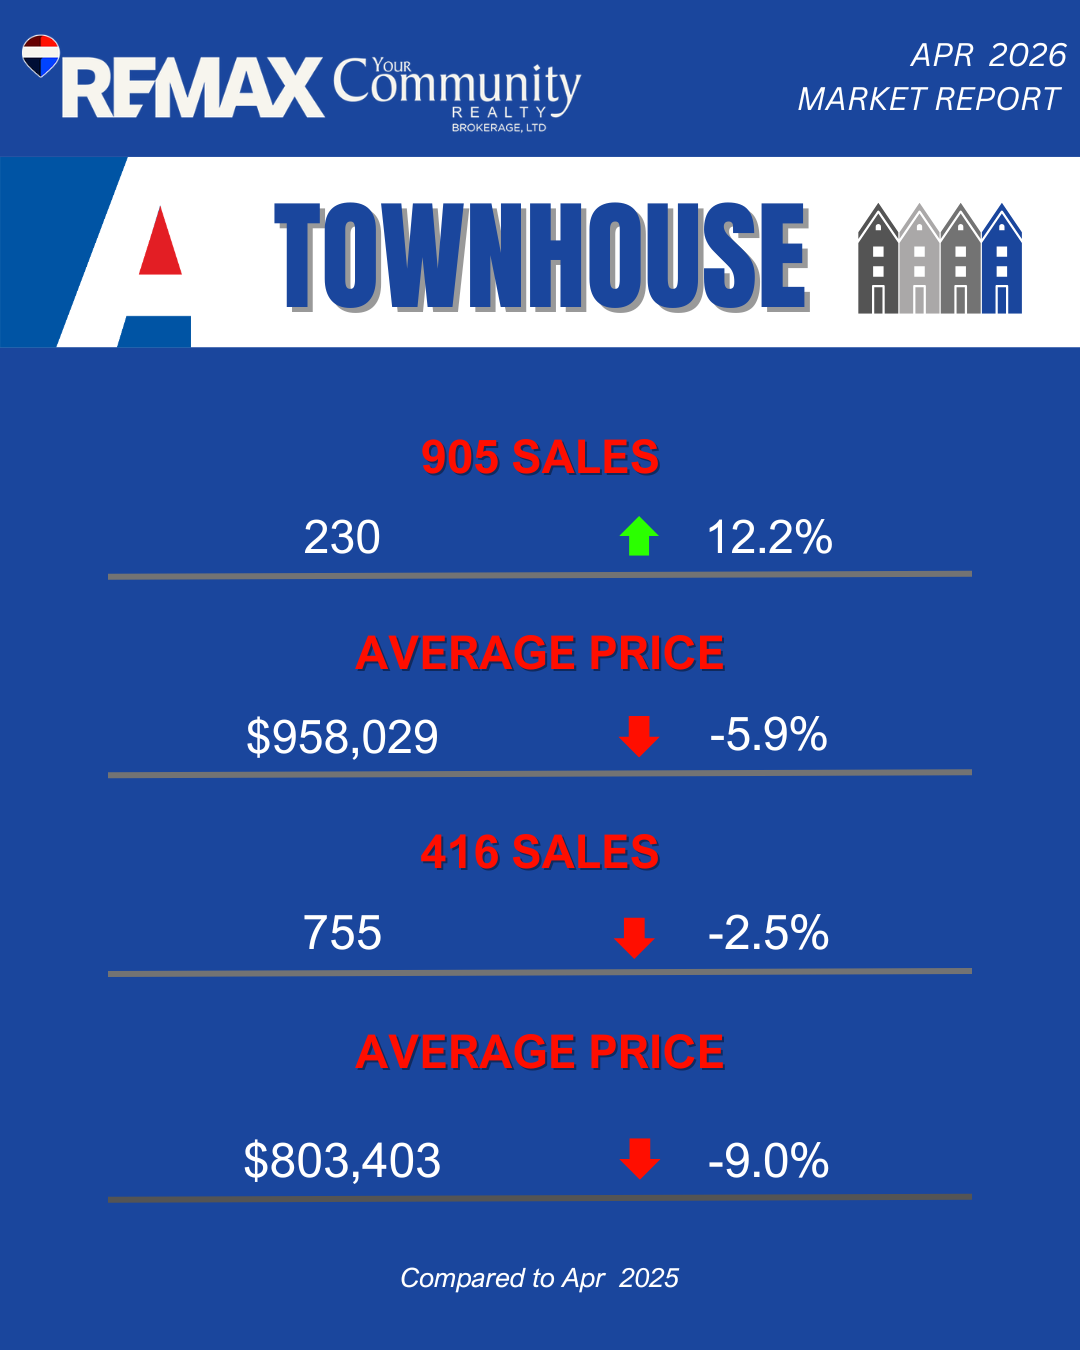
Townhouses
Townhouses recorded 985 sales in April 2026, split between attached/row-townhouses (566 sales, avg $939,197) and condo townhouses (419 sales, avg $704,847). Together, the segment represents 16.5% of all GTA transactions — and continues to attract the broadest buyer demographic, from young families to empty-nesters seeking ground-level living.
416 (City of Toronto)
Sales: 230 transactions in April 2026.
Average Price: $958,029.
Trend: Prices are down only 5.9% year-over-year while sales jumped 12.2%. Toronto townhouses have now posted two consecutive months of double-digit sales growth — the most consistent demand recovery in the city.
905 (GTA Suburbs)
Sales: 755 transactions in April 2026.
Average Price: $803,403.
Trend: Prices pulled back 9.0% year-over-year and sales slipped 2.5%. New-build townhouse supply continues to weigh on the resale market in select 905 pockets.
Insight: 416 townhouses are now officially the breakout story of spring 2026. Twelve percent sales growth signals city buyers have identified this as the value tier in an otherwise expensive market. If you own a properly-located Toronto townhouse — Leslieville, The Junction, Roncesvalles, Riverdale — you are in the strongest seller’s position you have been in since 2022. List with discipline; the buyers are there.
Condo Apartments
The condo apartment segment delivered the most dramatic shift of the month: 1,553 sales — up 9.1% year-over-year, representing 26.1% of all GTA transactions. With an average price of $635,653, the condo market remains the most accessible entry point into GTA homeownership — and after multiple quarters of price correction, the buying activity is finally catching up to the value.
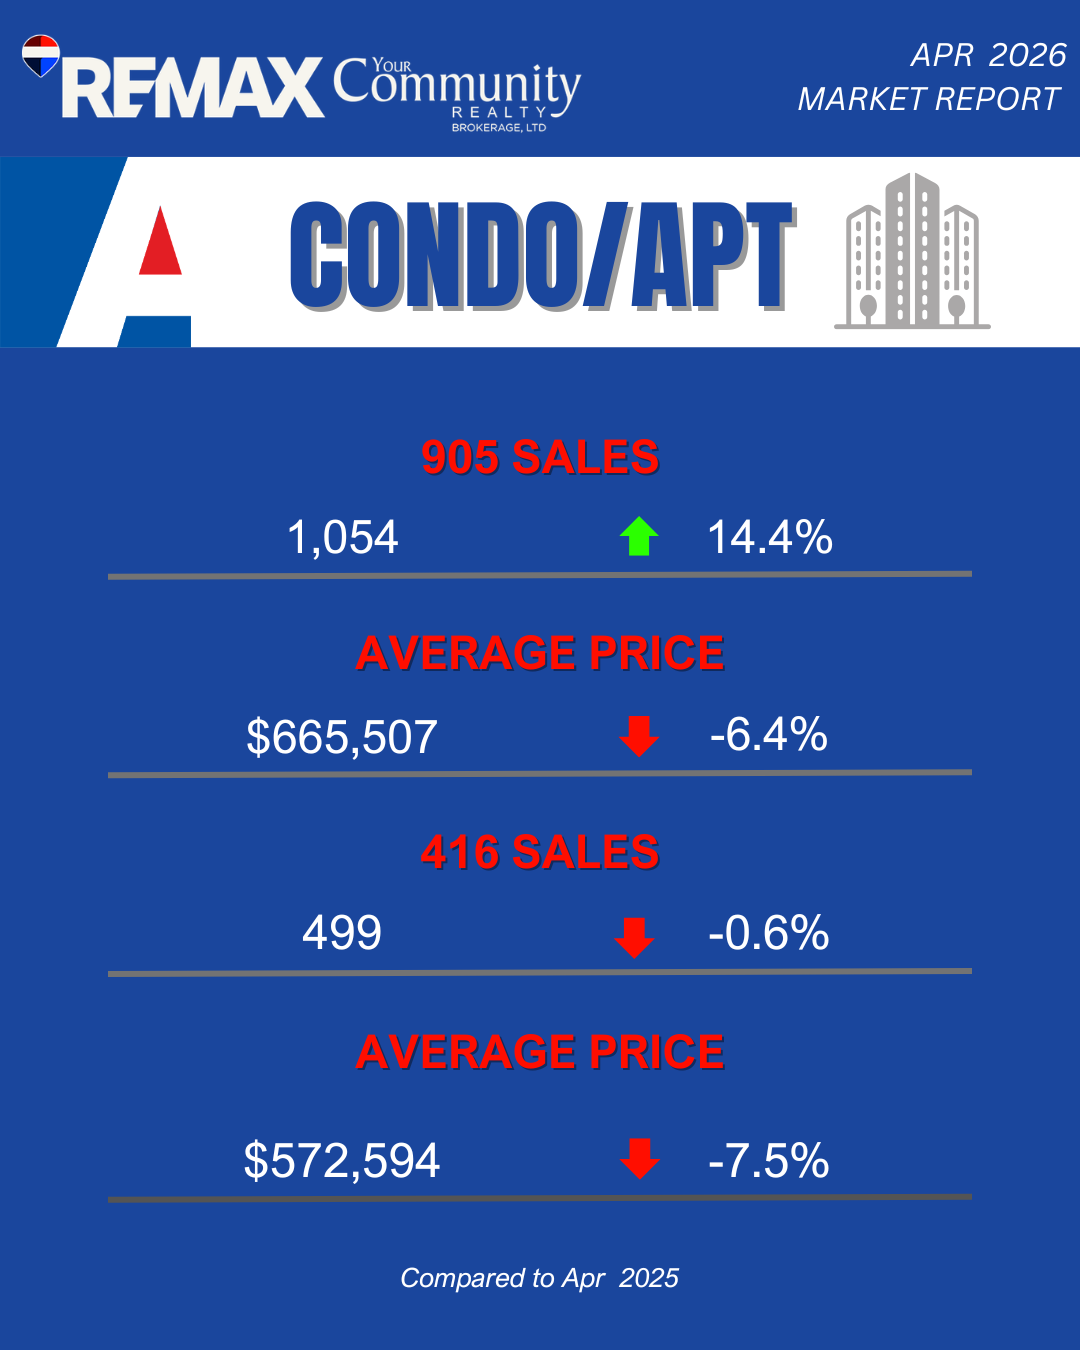
416 (City of Toronto)
Sales: 1,054 transactions in April 2026.
Average Price: $665,507.
Trend: Prices declined 6.4% year-over-year, but sales jumped 14.4% — the largest sales gain of any segment in the GTA. The reset is working. Buyers are returning at scale to the downtown and waterfront condo markets.
905 (GTA Suburbs)
Sales: 499 transactions in April 2026.
Average Price: $572,594.
Trend: Down 7.5% year-over-year on price; sales essentially flat (-0.6%). 905 condo demand is stable, with sub-$600K product attracting first-time buyers priced out of freehold.
Insight: A 14.4% sales jump in 416 condos is the most decisive market signal in this report. After 18 months of correction, investor and end-user buyers have made their move. The Bank of Canada at 2.3%, condo prices roughly 15% off the 2022 peak, and a tightening listing environment is exactly the alignment professional investors wait for. If you are positioning a condo investment for a 3-to-5-year horizon, the entry window is closing in real time.
GTA Hotspots: Where the Market is Moving
April 2026 sharpened the regional divergence. Here is where buyer competition is most intense right now:
Toronto East (E01–E11): 546 sales | 102% sale-to-list ratio | Average 26 days on market. Toronto East remains the single most competitive submarket in the GTA. Sellers continue to receive over asking. Buyers in Leslieville, Riverdale, Beaches, and Danforth need to come prepared with strong, clean offers.
Durham Region: 708 sales | 99% sale-to-list ratio | Average 23 days on market — the fastest-moving region in the GTA. Ajax, Pickering, Whitby, and Oshawa are all running near 100% SP/LP, fueled by affordability advantages over Toronto and consistent commuter demand.
Toronto West (W01–W10): 717 sales | 100% sale-to-list ratio | Average 28 days on market. Pockets of intensity remain in W01 (Roncesvalles/High Park) and W02 (The Junction), with the broader west end showing balanced-to-firm conditions.
York Region: 964 sales | 98% sale-to-list ratio | Average 29 days on market. Markham, Vaughan, and Richmond Hill are seeing renewed move-up activity, with the highest-end submarkets (King, parts of Vaughan) showing the most price negotiation room.
Toronto Central (C01–C15): 1,049 sales | 97% sale-to-list ratio | Average 31 days on market. Still the most buyer-friendly submarket in the city — condo-heavy districts (C01, C08, C14, C15) continue to offer negotiating room. But with 416 condo sales up 14.4% YoY, that room is shrinking week by week.
Economic Backdrop
The macro backdrop continues to support the market shift. The Bank of Canada’s overnight rate is holding at 2.25%, with prime at 4.5%. One-year fixed mortgage rates are at 5.49%, three-year at 6.05%, and five-year at 6.09%. Inflation has ticked up modestly to 2.4% (March data) but remains within the Bank’s target band.
On the cautious side: GDP contracted 0.6% annualized in Q4 2025, Toronto employment growth was -0.3% in March, and the Toronto unemployment rate remains elevated at 8.1%. These pressures explain why a portion of would-be sellers are still on the sidelines — and why new listings have continued to lag sales growth. As TRREB Chief Information Officer Jason Mercer put it: “We still have a substantial amount of pent-up demand in the marketplace. More certainty on the trade front and an easing in geopolitical tensions would result in further improvements in market activity.”
Translation: when the trade and geopolitical fog clears, the next leg of demand — the one currently sitting on the sidelines — will hit a market that is already tightening. That is the setup buyers should be reading right now.
What This Means for You
If You Are a Buyer: The window of maximum opportunity is now actively closing. Sales are up 7.0% YoY, new listings are down 9.3%, active inventory is shrinking, and the average price ticked up month-over-month on a seasonally adjusted basis for the first time this cycle. The combination of lower prices than 2025, a Bank of Canada at 2.3%, and visibly tightening supply does not persist forever — and historically, conditions like this are followed by 6-to-12 months of price recovery. If you have been waiting for confirmation, this report is it. The cost of waiting another quarter is now measurable.
If You Are a Seller: You are in the strongest position you have been in since 2022. New listings are down 9.3% YoY, which means well-priced, well-presented homes are facing significantly less competition. The 98% overall sale-to-list ratio, 29-day average list-to-sale time, and tightening active inventory are all working in your favour. If you have been deferring a listing decision, the spring 2026 window is open right now. Pricing discipline still matters — buyers are informed — but the leverage has clearly shifted.
If You Are an Investor: The 416 condo segment posting 14.4% sales growth at 6.4% lower YoY pricing is the textbook bottom-formation pattern. The Bank of Canada has held rates accommodative, structural housing supply remains constrained (TRREB’s “Removing Roadblocks” policy report just released this month underscores how slow new supply moves), and rental demand fundamentals across the GTA remain robust. For 3-to-5-year horizons, this is the entry environment professional investors wait years for. Move with discipline — but move.
Ready to Act on This Market?
Whether you are buying your first home, executing a strategic move-up, listing a property you have held for years, or building an investment portfolio — the April 2026 data is no longer ambiguous. The market has turned. The question is what you do with that information.
I work with buyers, sellers, and investors across the GTA — from first-time purchases to complex multi-property transactions — and I am here to help you navigate this market with precision and confidence. Let’s talk about exactly what this data means for your specific situation, your timeline, and your numbers.
Data sourced from TRREB Market Watch, April 2026. Released May 5, 2026. All figures represent Greater Toronto Area MLS® System activity.