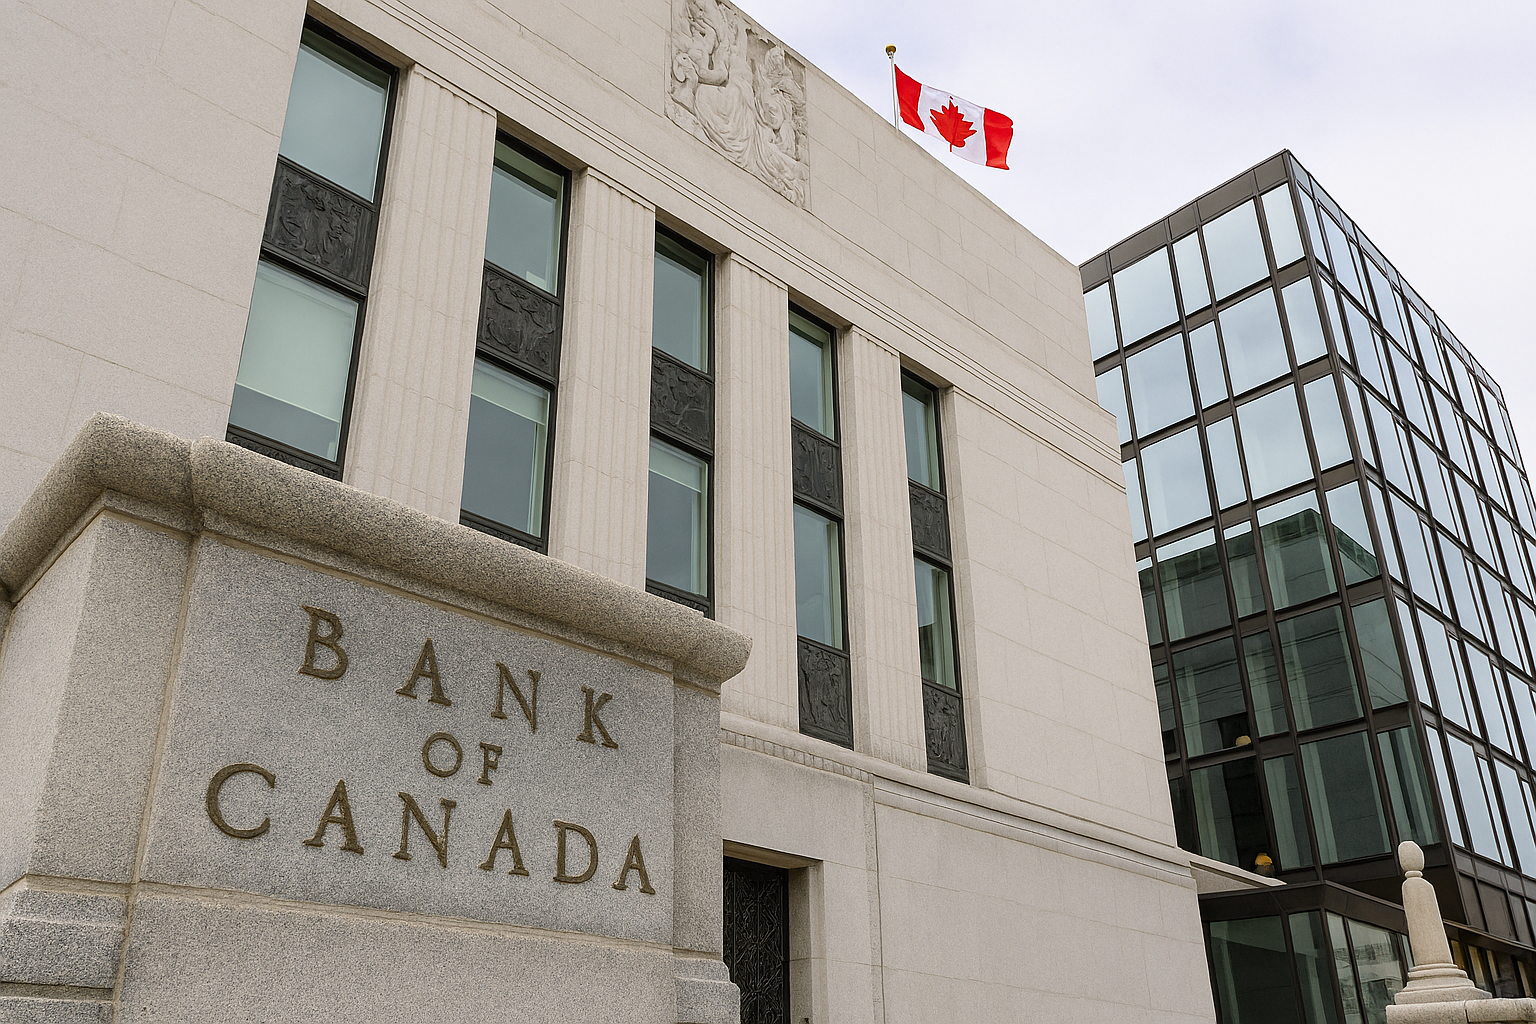
In a world full of rapid changes and economic uncertainty, everyone is looking for a little stability. For those of us navigating the dynamic real estate landscape of the Greater Toronto Area (GTA), a recent announcement from the Bank of Canada provides just that: a solid foundation upon which to build your future. The central bank has confirmed it will not change its 2% inflation target in the upcoming 2026 monetary policy framework renewal.
This isn't just a dry economic decision; it's a powerful statement that has direct and positive implications for every buyer, seller, and investor in the GTA. It signals a "new normal" where the framework for a healthy, predictable housing market is firmly in place, even when the world around us feels unpredictable.
What Does a 2% Inflation Target Actually Mean?
To understand the significance, let's break down the basics. Inflation is the rate at which the general price of goods and services rises, and it erodes your purchasing power. Think of it this way: what a dollar buys today might buy less tomorrow. The Bank of Canada’s primary job is to control this, keeping it at a stable 2% midpoint within a 1-3% range. They do this by adjusting the policy interest rate, also known as the overnight rate.
The key is this: the 2% inflation target is the long-term goal, not a fixed interest rate. The policy interest rate is the tool they use to reach that goal. The recent decision to stick with the 2% target shows their confidence in this system and its ability to act as a crucial anchor for long-term economic planning. While the overnight rate will still move up or down based on economic conditions, its movements will be aimed at a clear, consistent objective.
The Direct Impact on the GTA Real Estate Market
So, how does this commitment to a stable inflation target affect the Greater Toronto Area's real estate? The effects are significant and far-reaching.
Mortgage Rates and Affordability
The central bank's policy rate directly influences the prime lending rate offered by commercial banks. When the Bank of Canada holds its course on a stable inflation target, it reduces the risk of sudden, aggressive interest rate hikes driven by a fear of runaway inflation. This predictability is a huge win for homeowners and buyers.
For Fixed-Rate Mortgages: The stability of the overall economic outlook helps keep long-term bond yields, which influence fixed mortgage rates, from experiencing wild swings. This allows you to lock in a rate with greater certainty about future borrowing costs.
Suggested Visualization: A line graph showing the Bank of Canada's policy interest rate and the average 5-year fixed mortgage rate over the last five years. The graph would highlight periods of volatility and then show how the rates are now settling into a more stable pattern, guided by a predictable inflation target.
A Deep Dive into Variable-Rate Mortgages: The New Strategic Advantage
The conversation around variable-rate mortgages has shifted dramatically. In a market where the Bank of Canada's direction is clear, choosing a variable rate is no longer just a gamble—it's a strategic decision.
A variable-rate mortgage is quoted as "Prime Rate plus or minus a discount." When the Bank of Canada changes its overnight rate, banks adjust their Prime Rate, and your mortgage interest rate moves with it. Here’s why this is so important right now:
Benefit from Rate Cuts: If the Bank of Canada begins to lower rates to stimulate the economy, your variable rate—and thus the interest portion of your payment—will drop with it. This allows you to benefit from a falling rate environment without having to renegotiate or break your mortgage.
Lower Penalties: Variable-rate mortgages typically come with a much lower penalty to break the term (often just three months' interest) compared to a fixed-rate mortgage. This flexibility is invaluable if your life plans change and you need to sell or refinance.
Convertibility: Most variable-rate mortgages have a "convert" feature that allows you to lock in to a fixed rate at any time, usually without a penalty. This gives you the best of both worlds: the potential for savings in a falling-rate environment and the option to switch to the security of a fixed rate if you become uncomfortable with fluctuations.
This is the key takeaway: while the overnight rate can still move, the Bank of Canada's firm commitment to a 2% inflation target means that any rate changes will be deliberate and part of a measured strategy, not an unpredictable reaction. This provides a level of certainty that makes a variable mortgage a powerful tool for sophisticated borrowers.
Property Values and Investor Confidence
In times of high inflation, real estate is often seen as a hedge—a safe place to park money as prices rise. However, that can lead to speculative bubbles and unsustainable growth. A stable, low-inflation environment encourages a more rational and sustainable appreciation in property values.
Steady, Sustainable Growth: The 2% target promotes a market where property values grow at a healthy, more predictable pace, rather than experiencing a boom-and-bust cycle. This protects the equity of existing homeowners and makes the market more accessible to new entrants.
A Magnet for Investors: This kind of stability is a massive draw for both domestic and international investors. They can forecast returns and plan their portfolios with a clearer picture of the economic future, reinforcing the GTA as a premier destination for real estate investment.
The GTA Market in a Global Context
Canada is part of a global economy, and we feel the effects of international events, from supply chain disruptions to geopolitical tensions. The Bank of Canada's decision provides a critical shield. By maintaining a clear and credible domestic policy, the central bank helps to buffer the Canadian economy—and by extension, the GTA real estate market—from external shocks.
This unwavering approach gives our market a competitive advantage. It builds international confidence, making the Canadian dollar and Canadian assets, including real estate, even more attractive to global capital looking for a safe haven.
What This Means for You
The Bank of Canada's commitment to its 2% inflation target is more than just a headline; it's a guidepost for your real estate journey.
For Buyers: This is your signal for stability. While rates can still move, the overarching goal is clear. Use this period to get pre-approved and plan your home search with a clear understanding of your borrowing costs. The "new normal" means you can make a purchase with more confidence and less risk.
For Sellers: While the frantic pace of past years has slowed, the market is fundamentally strong. This predictable environment ensures that your property's value is well-supported and a clear advantage to prospective buyers.
For Investors and Landlords: The stability allows for more accurate forecasting of returns and rental income. You can confidently expand your portfolio, knowing that the underlying economic framework supports long-term, sustainable growth. For tenants, this stability can lead to more predictable rent increases, taking some of the guesswork out of their future housing costs.
The Bank of Canada’s decision anchors our market, turning a period of uncertainty into an opportunity for strategic action.


